MicroStrategy ONE
Calculating metrics at the level of a Grid/Graph and a group: Group Headers and Group Footers
Before you begin
This topic assumes that you understand the levels of metric calculation on a report. For background information, see About metrics. It also assumes that you are familiar with the different document sections. For descriptions of the document sections, see Understanding and working with document sections.
A metric placed in a Grid/Graph is calculated at the level defined by the attributes, consolidations, and custom groups on the Grid/Graph, as described in Calculating metrics at the level of a Grid/Graph. When the Grid/Graph is placed in a Group Header or Group Footer, the level of the group is also included in the metric calculation, but only for those grouping fields that exist on the dataset to which the Grid/Graph belongs.
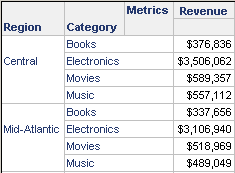
For example, a report contains the Region and Category attributes, as well as the Revenue metric. A portion of this report is shown below:

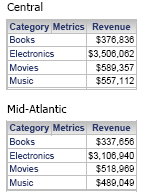
This report is used as the dataset for a document. The document is grouped by Region, and its Group Header contains a Grid/Graph with Category and Revenue. The Group Header also contains the Region name, to indicate the different groups. A portion of the document is shown below:

The revenue values are calculated at the level defined by the Grid/Graph (Category) but also at the group level (Region). Each Grid/Graph contains the revenue for its specific region and no others. The group (Region) exists on the dataset of the Grid/Graph.
Consider another document, which contains two datasets:
-
Dataset 1 contains Region, Category, and Revenue. It is the grouping and sorting dataset. (For more information about the grouping and sorting dataset, see Changing the grouping and sorting dataset for a document.)
-
Dataset 2 contains Region, Call Center, and Revenue.
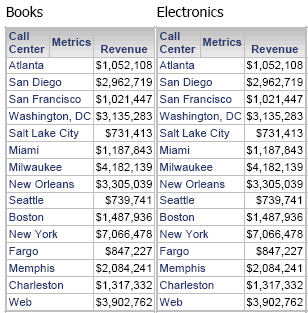
The document is grouped by Category (from Dataset 1). A Grid/Graph containing Call Center and Revenue (from Dataset 2) is placed on the Group Header. The Group Header also contains the Category name, to indicate the different groups. The Group Header is displayed horizontally, so that the Grid/Graphs are easier to compare. A portion of the document is shown below.

Notice that the revenue values are the same for each Call Center, regardless of which Category is displayed. The revenue values are calculated at the level defined by the Grid/Graph (Call Center) but not at the group level (Category). Each Grid/Graph contains the revenue for all categories. The group (Category) does not exist on the dataset of the Grid/Graph.
If the Grid/Graph does not contain any objects other than the metric, the metric behaves as though it were in a text field in the same document section. As with metrics in text fields in Group Headers and Group Footers, the calculation is determined by the metric's definition, specifically by the dynamic aggregation function. For more information on how dynamic aggregation works in documents, see Dynamic aggregation in documents.
