MicroStrategy ONE
Calculating metrics at the level of a Grid/Graph
Before you begin
This topic assumes that you understand the levels of metric calculation on a report. For background information, see About metrics. It also assumes that you are familiar with the different document sections. For descriptions of the document sections, see Understanding and working with document sections.
A metric placed in a Grid/Graph is calculated at the level defined by the attributes, consolidations, and custom groups on the Grid/Graph.
-
If the Grid/Graph is placed in a Group Header or Group Footer, the level of the group is also included in the metric calculation. For more information on Grid/Graphs in Group Headers and Group Footers, see Calculating metrics at the level of a Grid/Graph and a group: Group Headers and Group Footers.
-
A Grid/Graph cannot be placed in the Detail section. This is because the Grid/Graph would be repeated on each row since controls in the Detail section are repeated once per row of the dataset.
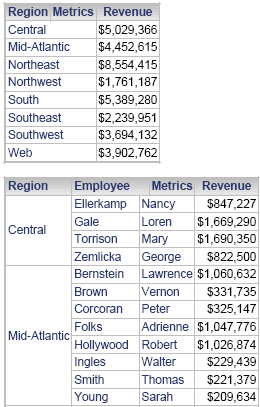
For example, a dataset contains the Region and Employee attributes, as well as the Revenue metric. A Grid/Graph containing all these objects is placed in the Detail Header section of the document. A second Grid/Graph, which contains only Region and Revenue, is placed in the Document Header. In the sample below, all of the Grid/Graph containing Region only is shown, but only a portion of the Grid/Graph with both Region and Employee is included.

The metrics in the Grid/Graphs are calculated at the level of the attributes in the Grid/Graphs—Region only in the top Grid/Graph, Region and Employee in the bottom one. If a Grid/Graph contained only Employee and Revenue, and an employee generates revenue in two regions, the metric value displayed in each region would reflect the total revenue of the employee, for both regions.
If the Grid/Graph does not contain any objects other than the metric, the metric behaves as though it were in a text field in that document section. A metric in a text field in any header or footer section other than a Group Header or Group Footer is calculated as a grand total, totaled across the entire dataset. For example, if Region and Employee were removed from the Grid/Graphs in the previous example, both Grid/Graphs calculate a revenue grand total, as shown below:

The calculation of grand totals is determined by the metric's definition, specifically by the dynamic aggregation function. For more information on how dynamic aggregation works in documents, see Dynamic aggregation in documents.
