MicroStrategy ONE
The Difference Between Report Filters and Report Limits
A report limit specifies a set of criteria used to restrict the data returned in the report after the report metrics are calculated. Because it is based on the report's metric values, a limit is applied after all the metrics are calculated. The difference between a filter and a report limit is shown in the following example.
Rank metrics apply a ranking number to the metric values for a given attribute. For an example, open the Sales Rank report. As shown in the following figure, this report is the Basic Report with two additional metrics, Revenue Rank and Revenue Rank (unfiltered).
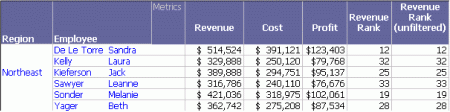
These metrics rank employees based on the Revenue metric. The Revenue Rank metric uses the report filter in its calculation, while the Revenue Rank (unfiltered) metric ignores this report filter. This feature allows both filtered and unfiltered values on the same report. For example, when a filter for the Northeast region is added to the report, the calculation for Revenue Rank (the filtered metric) uses only the employees in that region. The unfiltered metric uses all the employees, regardless of region, to calculate its rank numbers. A complete example is provided in Filtering with Rank below. Metric level filtering is also explained in more depth in Filtering: Interaction with Report Filters. In the report sample above, these two metrics display the same value because the report does not contain a filter.
Sorting on Rank
To make the order of ranking easier to view, sort by the rank metric. In Grid View, right-click the Revenue Rank column and select Sort rows by this column. As you can see from the following report sample, the rows are re-arranged based on the value in the Revenue Rank column. The report data does not change, only its order on the report changes.
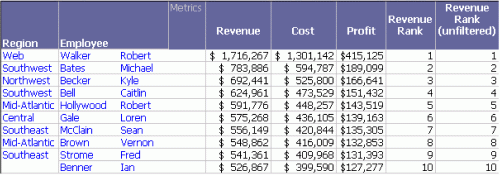
This report is saved as Sort by Revenue Rank.
Filtering with Rank
Switch to the Design View to add the Month filter to the sorted report. When you re-execute it, note the changed values in the Revenue Rank metric. In the following sample, the rankings that have changed are highlighted.
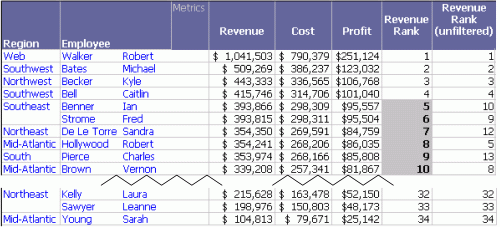
This report is saved as Sort by Revenue Rank - Month Report Filter.
In the previous report, Ian Benner's revenue was $526,867, which placed him as the tenth highest revenue producer. In this new report, his revenue is calculated at $393,866 because the report filter is applied before the metric value is determined. The revenue does not include April, May, and December. His new revenue rank is calculated as five, since the report filter affects the data used to calculate the Revenue metric. However, the Revenue Rank (unfiltered) metric still returns a ten because it is set to ignore the report filter.
Report Limits with Rank
Open the Sort by Revenue Rank report. Notice that the highest rank is 34 and there are 34 rows in the report. Now, add a report limit of revenue greater than $320,000. (For steps to add a report limit, see the online help.) Re-execute the report to see the following results.
This report is saved as Sort by Revenue Rank - Report Limit - Revenue > 320K.
Notice that the highest rank is now 32 and there are only 32 rows on the report. The last two rows from the previous report have disappeared because the revenue in each row was less than the report limit. None of the metrics changed values because a report limit does not affect how the metrics are calculated; the limit is applied at the level of the report after the metrics are calculated.
Simultaneous Report Filters and Limits
Both report filters and report limits can be used on the same report because they are applied at different stages of the execution cycle.
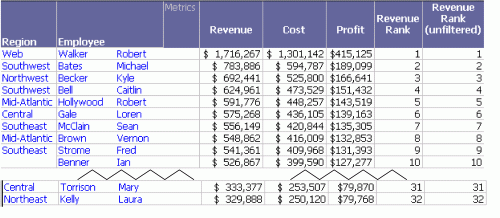
Right-click the Sort by Revenue Rank report on MicroStrategy Developer to open it in the Design View for editing. Add the Month filter as the report filter and a report limit of revenue greater than $320,000, as described previously. Execute the report. The results appear as displayed in the following figure.
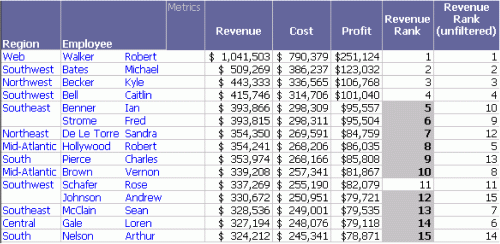
This report is saved as Sort by Revenue Rank - Report Filter & Report Limit.
Notice that the report is much smaller than either the Sort by Revenue Rank - Month Report Filter report or the Sort by Revenue Rank - Report Limit - Revenue > 320K report. Only 15 rows are returned, as opposed to 34 or 32. Also notice that the Revenue, Cost, Profit, and Revenue Rank values are the same as the filtered report. However, the Revenue Rank (unfiltered) values are the same as the Revenue Rank - Limit.
The first step in creating this report is calculating metrics. The data used in the metrics is restricted by the report filter, so information from April, May, and December is not included. All the metrics are calculated using this data, except for the unfiltered metric, which ignores the report filter. Its values are calculated on the full year's worth of data.
The results after all the metric calculations are completed form the report result set. The report limit is applied to this result set. The employees with revenue less than $320,000 (the report limit) are removed from the display before the report is presented. Because the revenue is calculated on fewer months than the Revenue Rank - Month Filter report, more employees are discarded than from the previous limit.
This means that the limit stays the same (greater than $320,000), but the filter changes the data considered in calculating each employee's rank.
A report filter affects the data used to calculate metrics, whereas a report limit does not affect how the metrics are calculated. Report limits are applied at the level of the report after the metrics are calculated.