MicroStrategy ONE
Filtering: Interaction with Report Filters
You can also place a filter, or condition, on a level metric. See Example of a Conditional Metric with a Level for an example and detailed description.
Filtering in the Products - By Top 10% Customers Report
Review the Products - By Top 10% Customers report described at the beginning of Level Metrics: Modifying the Context of Data Calculations. In the report, the % of All Revenue (by Product) metric divides the Revenue metric by a metric called Revenue (Dimensionality All Products). The Revenue metric is calculated at the report level, in this case, for each product. The level of the Revenue (Dimensionality All Products) metric has been set to product, with filtering set to standard. The report filter contains a prompt for quarter and a filter for the top ten percent of customers based on revenue. Standard filtering means that revenue is calculated for only the quarter selected in the prompt.
The filtering is indicated in the metric definition. Standard filtering is indicated by a plus sign after the target, as shown in the definition of the Revenue (Dimensionality All Products) metric shown below:
Revenue {~+, !Product+}
If you open this metric and do not see the plus sign, select Show level (dimensionality) properties from the View menu.
Level Filtering Examples
All of the metrics in these examples, except the first report, have grouping set to none.
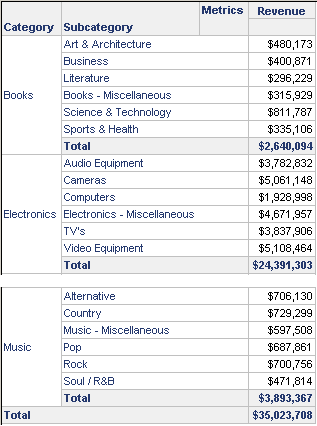
Consider the following report as a baseline to show the revenue for each Category and Subcategory.
None of the reports in these examples are presented in full; they are only subsets of the complete report.
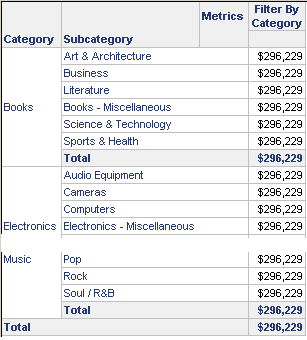
A revenue metric is defined with Category as the target, no grouping, and standard filtering. A report is created with Category, Subcategory, this new revenue metric, and a filter for the Literature subcategory. When the report is executed, the revenue is the same for every row, as shown below. All categories are included on the report, even though the report filter is Literature. This is an effect of setting the grouping to none. Since Category in the target is a parent of Subcategory in the filter, all subcategories are included on the report. The metric value is the grand total of the filter, in this case, only Literature.
The same report is created with a metric set to absolute filtering and no grouping. When the report is executed, the revenue is the same for every row, as shown below. Because of the absolute setting, the report filter rolls up to the level of the metric, and thus Subcategory is elevated to Category. Because the report is filtered for the Literature subcategory, the value is revenue for the Books category.
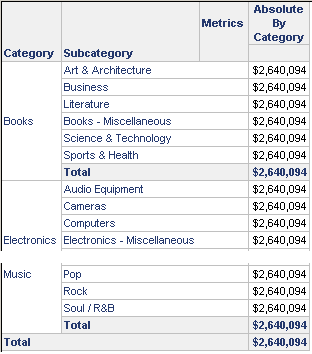
If level (dimensionality) options are shown, the metric definition looks like Sum(Revenue) {~+, !Quarter*}. The asterisk denotes absolute filtering, the exclamation mark that grouping is set to none. See Metric Level Symbols: Defining Expression Syntax.
The same report is run, but this time with a metric that has level filtering set to ignore. Grouping remains set to none. Again the metric value is the same for the whole report, but now it is the grand total of all sales in the project. Since Category is related to Subcategory, the filter is also ignored.
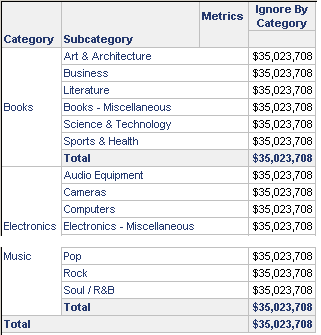
If level (dimensionality) options are shown, the metric definition looks like Sum(Revenue) {~+, !Quarter%}. The percent sign denotes ignore filtering.