Strategy ONE
Customize a Tooltip for a Visualization in the Gallery
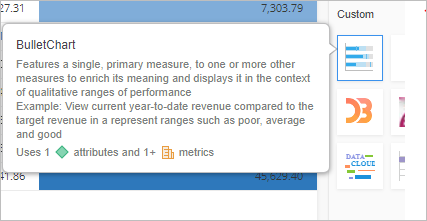
You can customize a tooltip for a visualization in the gallery. This tooltip includes a full description of what the visualization represents, a sample use case for the visualization, and the number of required attributes and metrics.
- Navigate to plugins\<your plug-in folder>\WEB-INF\xml\config\visualization.xml in your plug-in folder of the MicroStrategy Web installation directory.
- Open visualization.xml. Locate the <visualization> node that corresponds with the visualization you want to customize the tooltip for.
-
Add the following attributes to the <visualization> node.
summary: Use this attribute to provide a full general description of the visualization.
use-case: Use this attribute to provide a specific example of how this visualization can be used.
requirements: Use this attribute to provide the number of attributes and/or metrics required for the visualization.
- Use requirements="Uses 2 ##attributes###" to only support attributes.
- Use requirements="Uses 1 #metric###" to only support metrics.
- Use requirements="Uses 1 ##attribute### and 3+ #metrics###" to support both attributes and metrics.
You must provide all three attributes together for the tooltip to take effect. These attributes have higher priority than attribute-minimum and metric-minimum. This means if you provide these three attributes, attribute-minimum and metric-minimum are ignored.
See the attributes in this sample code for the BulletChart visualization.Copy<visualizations>
<visualization-list name="ajax">
<visualization
id="BulletChart"
desc="Bullet Chart"
...
summary="Features a single, primary measure, to one or more other measures to enrich its meaning and displays it in the context of qualitative ranges of performance"
use-case="Example: View current year-to-date revenue compared to the target revenue in a represent ranges such as poor, average and good"
requirements="Uses 1 ##attribute### and 2+ #metrics###"
attribute-minimum="2"
metric-minimum="1">
</visualization-list>
</visualizations> -
You can replace any characters in the value for requirements except #metric###, #metrics###, ##attribute###, and ##attributes###. This is because the logic in the code replaces the # and ### for metrics and ## and ### for attributes with an opening and closing <span> tag whose class is set to the metric or attribute icon used in the tooltip.
See the code that includes this logic.Copyvar metricIcon = '<span class="icon vi-tooltip-metricIcon">',
attrIcon = '<span class="icon vi-tooltip-attrIcon">',
requirements = item.requirements // e.g. 'Uses 1+ ##attributes### and 1 #metric###'
.replace(/###/g, '</span>')
.replace('##', attrIcon)
.replace('#', metricIcon); - Save your changes to visualization.xml.
-
If the plug-in is already deployed on a web server, restart the web server for the changes to take effect.
-

