Strategy ONE
D3 Simple Bar Chart
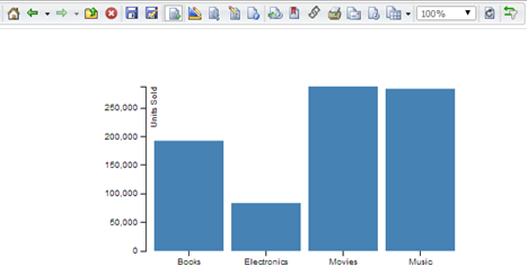
This sample visualization renders a simple graph using the D3 library. It renders a bar chart for concatenated attributes and the first metric in the report grid. It is very similar to the Google Chart sample. It is based on a D3 tutorial created by Mike Bostock.

The sample code in this visualization helps you learn how to use the D3 library in a MicroStrategy visualization.
A ready-to-use plug-in has been provided for this sample. To view the D3 Simple Bar Chart sample visualization in a dashboard in MicroStrategy Web:
-
Download the plug-in and copy it to the plugins folder of the MicroStrategy Web installation directory.
-
Restart your Web server.
- Open MicroStrategy Web and click Create Dashboard.
-
Click the Add Data icon, select Add Existing Dataset, and add a dataset with at least one attribute and one metric. For example, navigate to Shared Reports -> MicroStrategy Tutorial -> MicroStrategy Platform Capabilities -> MicroStrategy SDK -> Units Sold, Revenue by Category and click Select.
-
Drag at least one attribute and one metric to the Editor tab.
-
From the visualization gallery (vertical list of icons to the right of the dashboard), under Custom, double-click the Bar chart with D3js icon.
-
The D3 Simple Bar Chart visualization is displayed in the dashboard.
Once you have deployed the D3 Simple Bar Chart plug-in to the appropriate environments, you can also use the visualization in a dashboard in MicroStrategy Desktop or in a document in MicroStrategy Web.
To understand how the visualization was created, you can look at the JavaScript and configuration files in the plug-in or you can follow the step-by-step instructions below to create the visualization yourself.
For a detailed explanation of the code needed to create this sample visualization, follow the instructions below.
- Create the Plug-In Structure
- Create the JavaScript That Renders the Visualization
- Add the CSS Formatting for the Visualization
- Add the Icon for the Gallery
- Register the Style Used to Render the Visualization
- Register the Visualization
- View the Visualization
Create the Plug-In Structure
Download MstrVisTemplate to a location on your local machine where you can modify the files it contains, and rename it as MstrVisD3BarChart. This provides the basic structure of the plug-in, with JavaScript and configuration files that you customize for this visualization. After you have finished modifying the files in the plug-in, you copy the entire plug-in folder to the plugins folder in the environments where you want to use it.
Create the JavaScript That Renders the Visualization
-
Under MstrVisD3BarChart/JavaScript/mojo/js/source, rename MstrVisTemplate as MstrVisD3BarChart.js and open it in a text editor.
-
Do a find and replace to convert all instances (6) of MstrVisTemplate to MstrVisD3BarChart.
-
You should see the following code to encapsulate all of the code for your visualization. All of the visualization code explained below goes inside this function. The code in your JavaScript file will have these beginning and ending tags.
Copy(function () {
...
}());Encapsulating the code is not a requirement, but it is a recommended practice.
-
You should see the following code to register your plug-in in the mojo object.
Copy// Define this code as a plugin in the mstrmojo object
if (!mstrmojo.plugins.MstrVisD3BarChart) {
mstrmojo.plugins.MstrVisD3BarChart= {};
}Let's review the code...MsttrVisD3barChart is the unique name of the plug-in (plug-in folder) that holds your visualization code, constructed as mstrmojo.plugins.{plugin name}.
-
You should see the following code to set the mojo super class that is required to run this visualization.
Copy// Custom mojo visualizations require the CustomVisBase library to render
mstrmojo.requiresCls("mstrmojo.CustomVisBase");Let's review the code...The CustomVisBase class is required for all mojo visualizations. You extend this class with your code.
-
You should see the following code to declare your visualization object and your variables and methods. In the next step, you will add new code and replace the code highlighted code shown below:
Copy// Declare the visualization object
mstrmojo.plugins.MstrVisD3BarChart.MstrVisD3BarChart = mstrmojo.declare (
// Declare that this code extends CustomVisBase
mstrmojo.CustomVisBase,
null,
{
// Define the JavaScript class that renders your visualization as mstrmojo.plugins.{plugin name}.{js file name}
scriptClass: 'mstrmojo.plugins.MstrVisD3BarChart.MstrVisD3BarChart',
plot: function () {
// ... ADD YOUR JS CODE ...
}
}
);Let's review the code...mstrmojo.plugins.MstrVisD3BarChart.MstrVisD3BarChart is the JavaScript file that holds the code for your visualization, constructed as mstrmojo.plugins.{plugin name}.{js file name}.
mstrmojo.CustomVisBase is the mojo super class that your class extends.
null represents the fact that you do not have any mixins at this point. Mixins are mojo objects that extend your class
scriptClass is a required variable that holds the name of your JavaScript class. It is constructed as mstrmojo.plugins.{plugin folder name}.{js file name}
plot is a function that triggers rendering the visualization. Since this is the starting point for all custom code, in this case all the code to render the visualization is placed inside this function. The code in this function is based on the D3 tutorial from http://bl.ocks.org/mbostock/3885304 by Mike Bostock.
-
Add the highlighted text shown below.
Copy// Declare the visualization object
mstrmojo.plugins.MstrVisD3BarChart.MstrVisD3BarChart = mstrmojo.declare (
// Declare that this code extends CustomVisBase
mstrmojo.CustomVisBase,
null,
{
// Define the JavaScript class that renders the visualization as mstrmojo.plugins.{plugin name}.{js file name}
scriptClass: 'mstrmojo.plugins.MstrVisD3BarChart.MstrVisD3BarChart',
cssClass: "mstrvisd3barchart",
errorDetails: "This visualization requires one or more attributes and one metric.",
useRichTooltip: true,
reuseDOMNode: true,
externalLibraries: [
{url: "http://d3js.org/d3.v3.min.js"}
],
/**
* Rendering bar graph using D3, more on http://bl.ocks.org/mbostock/3885304
*/
plot: function () {
if(this.domNode.childNodes.length===1){
this.domNode.removeChild(this.domNode.childNodes[0]);
}
var margin = {top: 10, right: 30, bottom: 50, left: 80},
width = parseInt(this.width,10) - margin.left - margin.right,
height = parseInt(this.height,10) - margin.top - margin.bottom;
var chart = d3.select(this.domNode).append("svg").attr("width", width + margin.left + margin.right)
.attr("height", height + margin.top + margin.bottom)
.append("g")
.attr("transform", "translate(" + margin.left + "," + margin.top + ")");
var x = d3.scale.ordinal()
.rangeRoundBands([0, width], 0.1);
var data = this.dataInterface.getRawData(mstrmojo.models.template.DataInterface.ENUM_RAW_DATA_FORMAT.TREE).children;
var metricName = this.dataInterface.getColHeaders(0).getHeader(0).getName();
x.domain(data.map(function (d) {
return d.name;
}));
var y = d3.scale.linear()
.range([height, 0]).domain([0, d3.max(data, function (d) {
return d.value;
})]);
var xAxis = d3.svg.axis()
.scale(x)
.orient("bottom");
var yAxis = d3.svg.axis()
.scale(y)
.orient("left");
chart.append("g")
.attr("class", "x axis")
.attr("transform","translate(0," + height + ")")
.call(xAxis);
chart.append("g")
.attr("class", "y axis")
.call(yAxis).append("text")
.attr("transform", "rotate(-90)")
.attr("y", 6)
.attr("dy", ".71em")
.style("text-anchor", "end")
.text(metricName);
chart.selectAll(".bar")
.data(data)
.enter().append("rect")
.attr("class", "bar")
.attr("x", function (d) {
return x(d.name);
})
.attr("y", function (d) {
return y(d.value);
})
.attr("height", function (d) {
return height - y(d.value);
})
.attr("width", x.rangeBand());
}
}
);Let's review the code...cssClass specifies the custom CSS class name that is appended to the visualization container.
errorDetails is the text that is displayed if there are errors in the JavaScript code.
useRichTooltip specifies that a small non-modal pop-up should be used to display additional information for the visualization. .
reuseDOMNode specifies that the existing DOM should be reused if possible in cases such as browser re-sizing or data change.
externalLibraries specifies that the D3 library should be used.
This code in comparison to previous samples:
-
Getting data for a D3-related visualization is simpler than for the Google Charts sample. You get the data using:
this.dataInterface.getRawData(mstrmojo.models.template.DataInterface.ENUM_RAW_DATA_FORMAT.TREE)
where
getRawData is a DataInterface method to return grid data constructed in a specific format. It has one parameter that defines the type of format to return. In this sample, the following parameter specifies that the data should be formatted in a D3-friendly way:
mstrmojo.models.template.DataInterface.ENUM_RAW_DATA_FORMAT.TREE
-
-
Save MstrVisD3BarChart.js. The client side code is ready. To see if you have created everything correctly, you can compare your file with the JavaScript file in the MstrVisD3BarChart plug-in provided for this sample.
Add the CSS Formatting for the Visualization
- In a text editor, open global.css, located under MstrVisD3BarChart/style. This is the CSS file that holds formatting information for the visualization.
- Use .custom-vis-layout.mstrvisd3barchart as the selector to make sure the formatting is only applied to the visualization. .custom-vis-layout is a default class of the visualization container and mstrvisd3barchart is set in the JavaScript code as the parameter cssClass.
-
Copy the code below, paste it into global.css, and save your changes.
Copy.custom-vis-layout.mstrvisd3barchart .bar {
fill: steelblue;
}
.custom-vis-layout.mstrvisd3barchart .bar:hover {
fill: brown;
}
.custom-vis-layout.mstrvisd3barchart .axis {
font: 10px sans-serif;
}
.custom-vis-layout.mstrvisd3barchart .axis path, .axis line {
fill: none;
stroke: #000000;
shape-rendering: crispEdges;
}
.custom-vis-layout.mstrvisd3barchart .x.axis path {
display: none;
}
Add the Icon for the Visualization Gallery
-
Under MstrVisD3BarChart/style/images, save the icon that you want to use for the visualization, with a unique name such as mstrVisD3BarChartIcon.png.
-
In a text editor, open Html5ViPage.css, located under MstrVisD3BarChart/style. This is the CSS file that holds formatting information for the icon in the visualization gallery. Replace the highlighted code shown below.
Copy.mstrmojo-VIGallery .mstrmojo-VIGalleryList .item.ic-MstrVisTemplate>div>div {
background-image: url(images/icon.png);
background-position: 0 0;
margin: 5px;
} -
Add the name of your visualization and the name of the icon file for your visualization.
Copy.mstrmojo-VIGallery .mstrmojo-VIGalleryList .item.ic-MstrVisD3BarChart>div>div {
background-image: url(images/mstrVisD3BarChartIcon.png);
background-position: 0 0;
margin: 5px;
}Let's review the code....mstrmojo-VIGallery .mstrmojo-VIGalleryList .item.ic-{plugin name} is the CSS selector for the visualization in the visualization gallery.
url(images/{icon name}.png is the path to the file for the icon used in the visualization gallery.
- Save Html5ViPage.css.
Register the Styles Used to Render the Data and Visualization
- In a text editor, open styleCatalog.xml, located under MstrVisD3BarChart/WEB-INF/xml.
- Set the name attribute to MstrVisD3BarChart.
- Set the description attribute to D3 Simple Bar Chart.
-
In the <ActualParameter> node whose name attribute is mojoClassName, set the value attribute to plugins.MstrVisD3BarChart.MstrVisD3BarChart.
Copy<!-- Define the style that renders your visualization -->
<!-- Replace value of name attribute (MstrVisTemplateStyle) with the style name for your visualization -->
<!-- Replace value of description attribute (Style to render visualization) with the description of the style for your visualization -->
<!-- description is NOT the value displayed in the visualization gallery for dossiers or in the list of visualizations available for documents -->
<Style name="MstrVisD3BarChart" description="D3 Simple Bar Chart" transform="ReportAjaxMojoVisualizationTransform">
<ActualParameters>
<ActualParameter name="documentStyle" type="1" value="RWGridJsonStyle"/>
<ActualParameter name="reportXMLStyle" type="1" value="VisualizationServerJsonDataStyle"/>
<ActualParameter name="mojoClassName" type="1" value="plugins.MstrVisD3BarChart.MstrVisD3BarChart"/>
</ActualParameters>
<Layouts>
<Layout layout_source="AppLayoutSourceFile"><![CDATA[/WEB-INF/xml/layouts/MojoVisualizationLayout.xml]]></Layout>
</Layouts>
</Style> - Save styleCatalog.xml.
Register the Visualization
- In a text editor, open visualizations.xml, located under MstrVisD3BarChart/WEB-INF/xml/config.
- Locate the visualization node. You are going to modify the visualization node's id, desc, and style-name.
- Set the id attribute to MstrVisD3BarChart.
- Set the desc attribute to Bar Chart with D3js. This is the name users see as an option for using the visualization in a dashboard or document.
- Set the style-name attribute to MstrVisD3BarChart. This is the name you gave the style that renders the visualization in the styleCatalog.xml file.
- Add a new attribute-minimum attribute and set it to 1. This specifies that the dataset used by the visualization must have at least one attribute.
-
Add a new metric-minimum attribute and set it to 1. This specifies that the dataset used by the visualization must have at least one metric.
Copy<visualizations>
<visualization-list name="ajax">
<!-- Define a new visualization, with the style name defined in stylecatalog.xml and with is-mojo="true"-->
<!-- id is a unique identifier for the visualization, such as the name of the plugin-->
<!-- desc is the name that is displayed in the list of visualizations for use in a document or dossier. Replace "name to be displayed for visualization" with the name to appear in the gallery or list.-->
<!-- is-mojo specifies whether this is a mojo visualization-->
<!-- scope is a bit-wise value that specifies which MicroStrategy objects the visualization can be applied to: -->
<!-- 2 Report grids in documents -->
<!-- 16 dossiers -->
<!-- style-name is the name of the style used to render the visualization. Replace "visualization rendering style" with the name of the style in styleCatalog.xml that renders the visualization-->
<visualization id="MstrVisD3BarChart" desc="Bar Chart with D3js" is-mojo="true" scope="18" style-name="MstrVisD3BarChart" attribute-minimum="1" metric-minimum="1"/>
</visualization-list>
</visualizations> - Save visualizations.xml.
View the Visualization
Follow the procedures below to view the visualization.
Copy the Plug-In Folder
- Copy the entire plug-in folder to the plugins folder in the environment where you want to use it.
- To use the visualization in MicroStrategy Web, copy the plug-in to the plugins folder in the MicroStrategy Web installation directory.
- To use the visualization in MicroStrategy Desktop on a Windows machine, copy the plug-in to the code/plugins folder in the MicroStrategy Desktop installation directory.
- To use the visualization in MicroStrategy Desktop on a Mac machine, right-click MicroStrategyDesktop.app, click Show Package Contents, and copy the plug-in to the Resources/code/plugins folder.
View the Visualization in a Dashboard in MicroStrategy Web
-
Restart the Web server.
- Open MicroStrategy Web and click New Dashboard.
- Click the Add Data icon, choose Select Existing Dataset, and add a dataset with at least one attribute and one metric. For example, in the MicroStrategy Tutorial project, navigate to Shared Reports > MicroStrategy Platform Capabilities > MicroStrategy SDK > Units Sold, Revenue by Category and click Select.
- From the visualization gallery (vertical list of icons to the right of the dashboard), double-click the Bar Chart with D3js icon.
View the Visualization in a Document in MicroStrategy Web
To view the visualization in a document in MicroStrategy Web, follow the instructions below to create a document and add the Bar Chart with D3js visualization. The instructions below assume that you have already deployed the plug-in.
- Restart the Web server.
- Open MicroStrategy Web and click New Document.
- In Design mode, add a dataset with at least one attribute and one metric to Dataset Objects. Drag it onto the document as a report grid.
- Right-click the report grid and select Properties and Formatting.
- On the Properties and Formatting dialog, choose Widget on the left. On the right, under Widget Selections, choose Widget > DHTML > Bar Chart with D3js and click OK.
-
Run the document in Express or Interactive mode to see what the visualization looks like and how it works. It should look like the visualization shown below.