Strategy ONE
Learn from Sample Code
The following samples are designed to help you learn how to build an HTML5 visualization that integrates with MicroStrategy. Each sample introduces and explains specific code in the JavaScript and XML configuration files .
|
This sample |
introduces how to: |
|
|
|
|
|
|
|
|
|
|
|
|
|
|
|
|
|
|
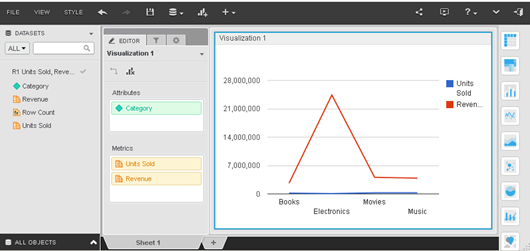
The instructions assume you are modifying the template plug-in provided for you. They provide the detailed JavaScript code needed for each visualization, with explanatory notes, as well as instructions for the changes that you need to make to the XML configuration files. The samples were created using the Units Sold, Revenue by Category report in the MicroStrategy tutorial as the dataset. This report, shown below, can be found in Shared Reports -> MicroStrategy Platform Capabilities -> MicroStrategy SDK.

While the Units Sold, Revenue by Category report was used to create and test all of the samples, there is no requirement to use this specific report. None of the samples is closely tied to the report, and there are no hard-coded dependencies. The only data requirement for all the samples is that the report grid that the visualization is applied to must contain at least one attribute and one metric.


