MicroStrategy ONE
Applying banding
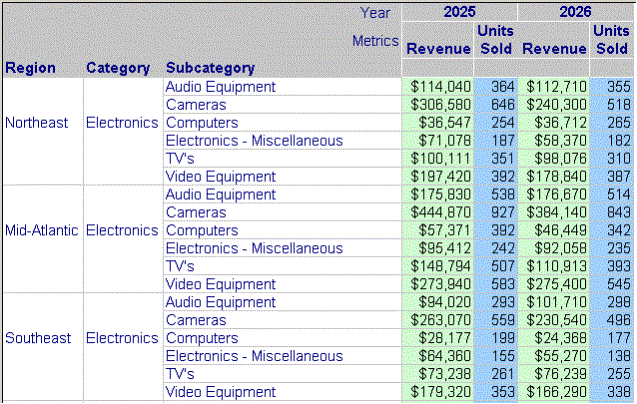
You can apply different colors to rows/columns or to different sections of your report. This is known as banding. Banding is a method of organizing (highlighting) values according to descriptive or meaningful data ranges, as shown in the image below:

Banding groups the data in rows or columns by color to enhance readability and, in some cases, identify attributes or attribute elements meeting certain criteria. You can set the banding in either of the following ways:
-
By number of columns/rows: creates bands of a user-defined number of columns or rows. Select the number of columns/rows for each band of color. The two colors are used alternately.
-
By column/row header: creates bands based on the selected column or row. The vertical (column)/horizontal (row) bands on the grid are colored according to the groupings on the selected column or row.
For example, you can highlight every third row or an entire column, such as Total Sales, to emphasize it.
System autostyles, such as Colorful and Accounting, have banding options set automatically. When one of these autostyles is applied to a report, the banding is applied to the report as well. Banding settings are saved as part of the autostyle.
Banding works the same for Grid/Graphs on a document as it does for reports.
