Strategy ONE
Auto Narratives Insights (Auto Adoption Dashboard)
Auto Adoption is only supported in MicroStrategy Cloud environments.
Starting in MicroStrategy ONE (September 2024) the Auto Narratives Insights page in your Auto Adoption Dashboard is an essential tool for tracking and analyzing the usage and performance of auto narratives within your MicroStrategy environment. This page provides a comprehensive overview of all auto narrative visualizations created across your dashboards, allowing you to monitor who is using them, how often they are being executed, and analyze overall performance. By offering detailed execution metrics and visualization summaries, the Auto Narratives Insights page empowers you to understand the impact of these narratives on decision-making processes within your organization.
For a deeper understanding of how auto narratives work and how to create them, see Auto Narratives.
Access Auto Narrative Insights
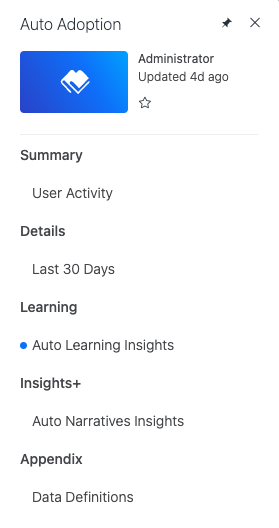
The Auto Narratives Insights page can be found under the Insights+ chapter of the Auto Adoption dashboard in the Platform Analytics project. The path to access this page is Platform Analytics/Shared Reports/1. Dashboards.
Navigate and Understand Auto Narratives Insights
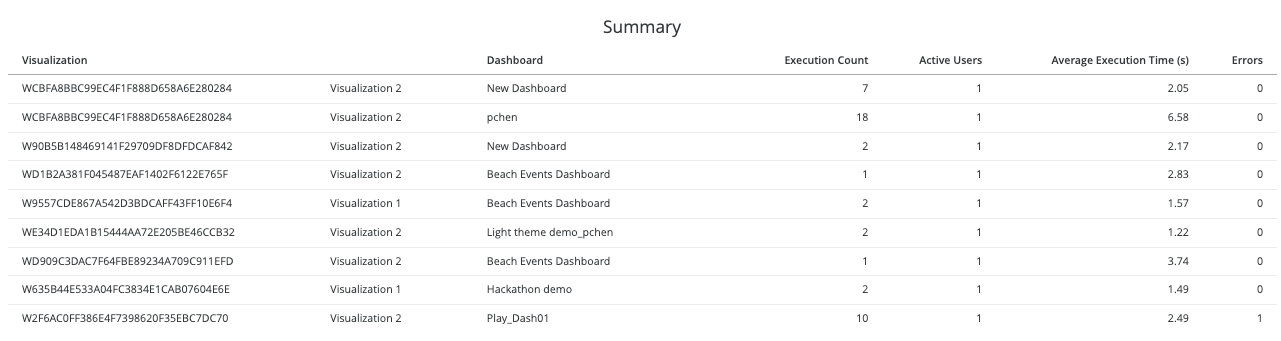
The Summary grid provides a list of all auto narratives visualizations that have been created in your environment. This section allows you to:
-
Sort by Execution Count and Active Users columns to identify which Auto Narratives Visualizations are the most popular.
-
See how well the narratives generation are performing by reviewing the average execution time.
-
Easily spot frequent errors by checking the error column for any issues during execution.
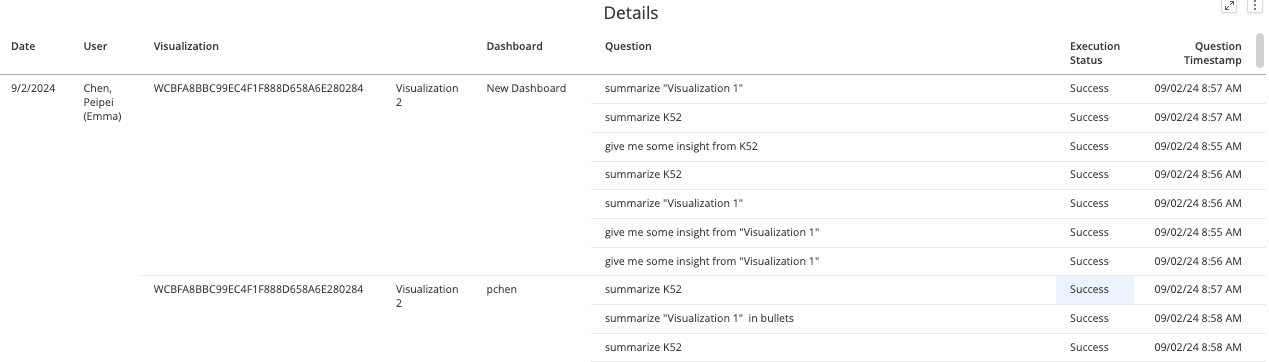
In the Details grid, you can drill down further into specific auto narratives executions. You can:
-
Track Usage See exactly who is using these visualizations, along with the date and time of their interactions.
-
Review Success Rates Check if the execution was successful and monitor whether there are any failures.
-
Access Detailed Questions Review the specific questions or instructions users provided to auto narratives, giving you a complete understanding of how the feature is being used.
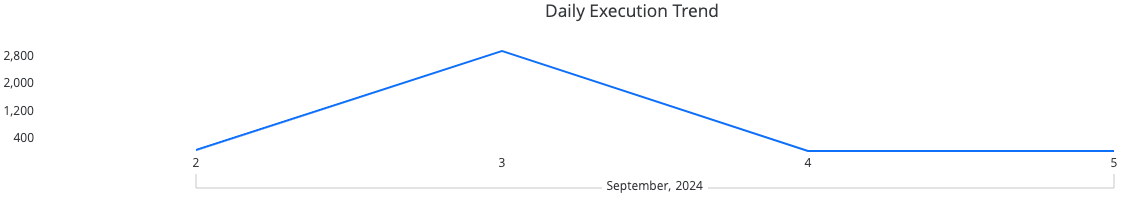
The Daily Execution Trend visualization provides insights into the adoption and usage patterns of auto narratives in your environment. By monitoring this trend, you can gauge how frequently auto narratives are used and identify any changes in usage over time.
Limitations and Constraints
The recorded execution time reflects the amount of time it takes to process, analyze, and generate the narrative by the AI service. It does not account for data fetching, rendering, or network delays.
Visualization names are updated only when the narratives are executed. Any changes made to the visualizations in the dashboard itself are not reflected until the narratives are run again.