Strategy One
Build Dashboards
-
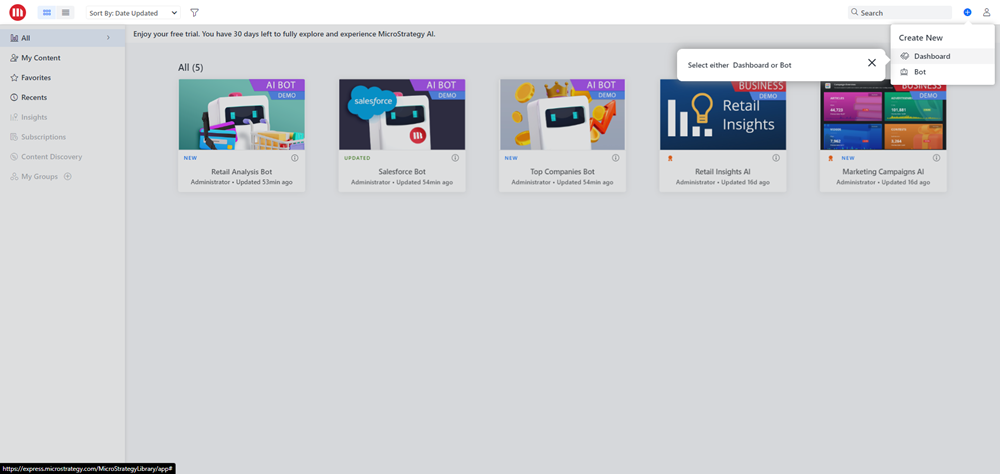
Click Create New > Dashboard.
-
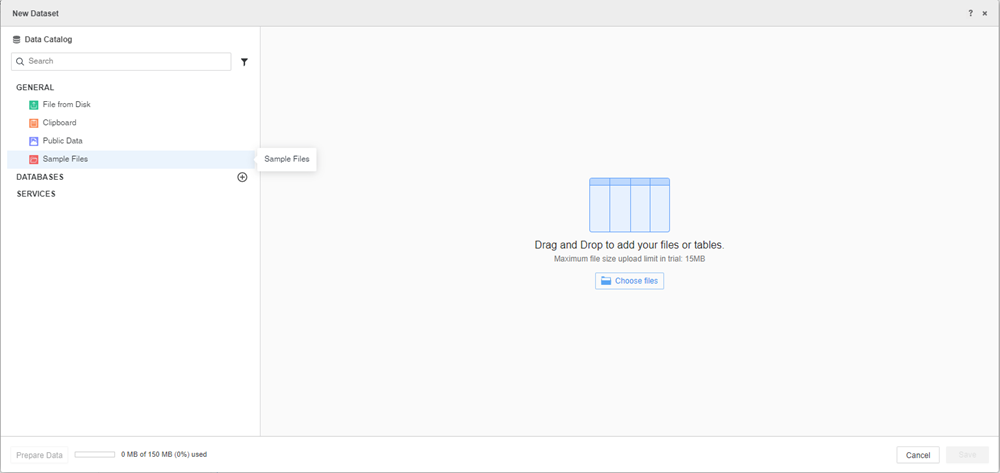
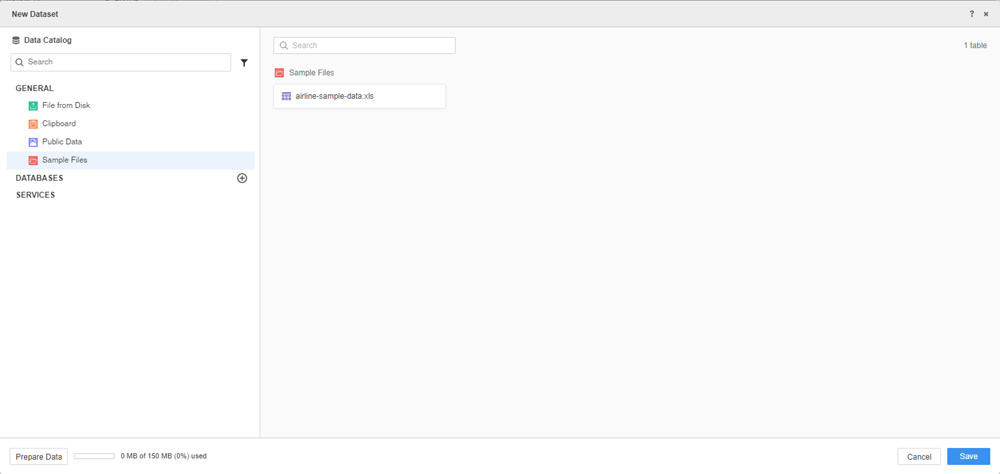
In the left pane, click Sample Files. To use additional data sources, see Add Data Sources and Import Database Tables for Dashboards
-
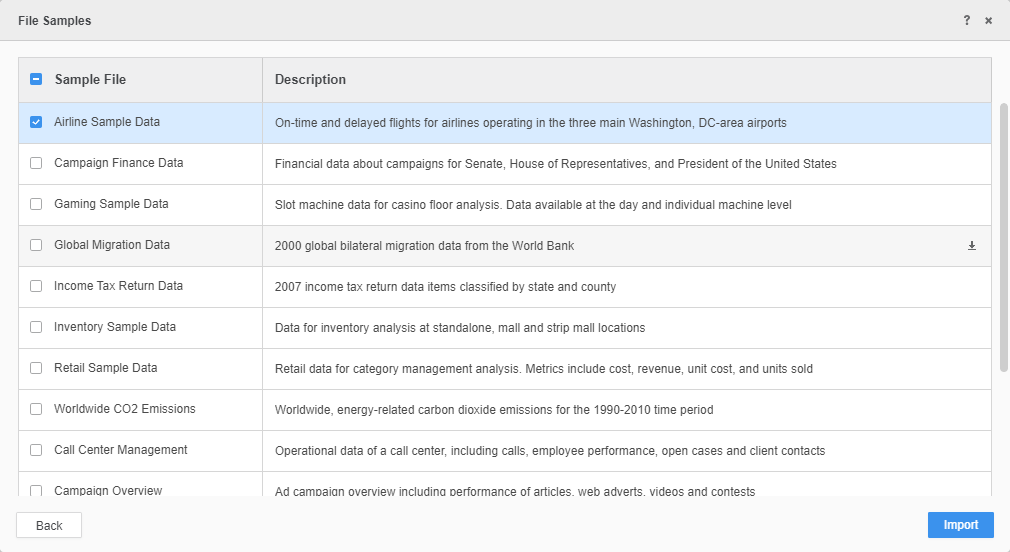
Select a sample file and click Import.
-
Click Save.
For information on using Prepare Data, see Prepare Data.
-
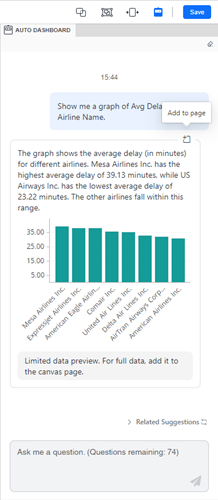
In the Auto Dashboard panel, select a suggestion or type a question.
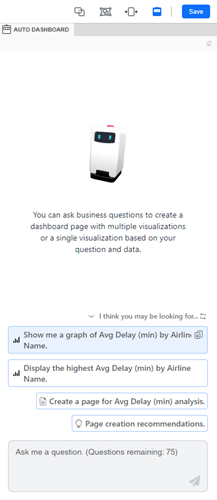
- Hover your mouse over the created visualization and click Add to page.
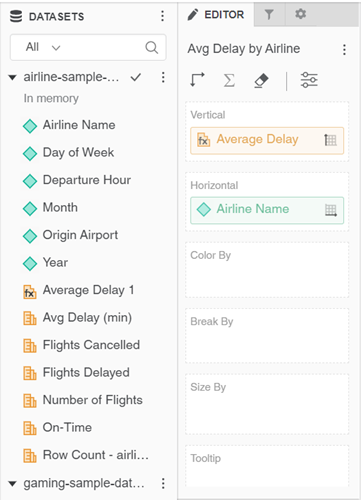
- Select a visualization and double-click attributes and metrics from the Datasets panel to add data to your visualization.
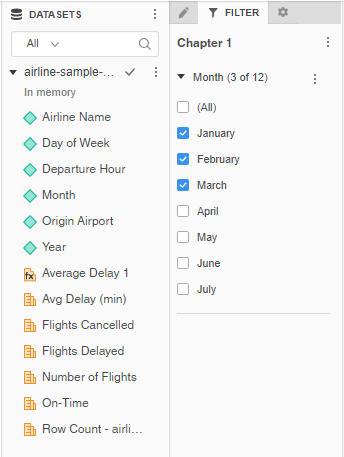
- In the toolbar, click Filter
 . Drag attributes and metrics from the Datasets panel to the Filter panel. Use the Ctrl key to select multiple attributes and metrics.
- In the toolbar, click Format
 . Use the options to customize your visualization.
 - Click Save.
- Type a name and description for the dashboard and click Save.
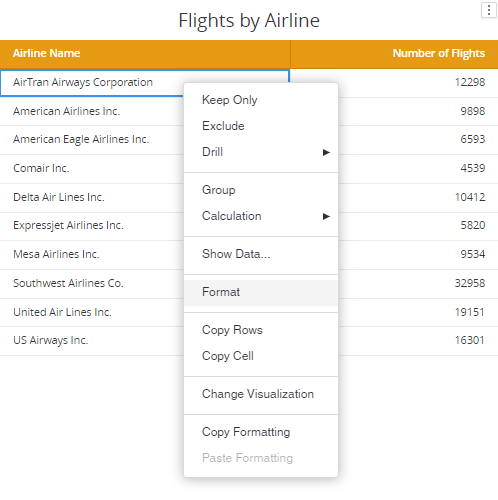
To manually create a visualization, in the top toolbar, click Visualization and choose from the various visualization options.
You can right-click in the visualization to further customize the visualization.