MicroStrategy ONE
Using a Grid or Graph as a Selector
Some grid reports and graph reports can be used as selector. When you click an object on the grid or graph, its targeted report or panel changes.
For example, two reports are displayed in a document. The grid on the left shows revenue by region. The graph on the right shows revenue by quarter and region. Notice that the two reports share a particular attribute (Region) and that the regions in the grid are underlined, which can indicate that they are used as a selector.
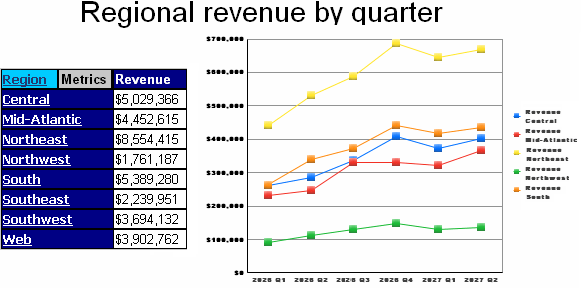
Click a specific region, such as Mid-Atlantic, in the grid. The graph changes to display information for that region only, as shown below:
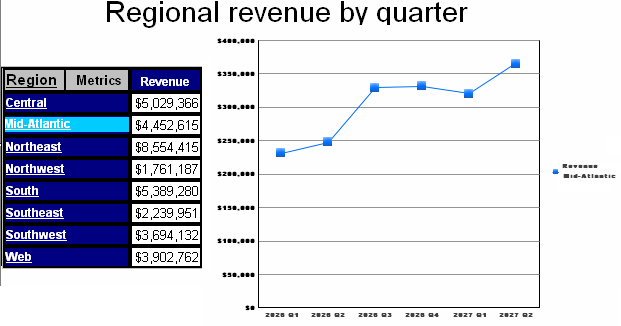
The grid on the left is controlling the graph on the right. In other words, this scenario uses one report as a selector targeting another report. The report does not become a selector, but performs in a manner similar to a selector. A panel stack, rather than another report, can also be the target of a report.
Related Topics
Interacting with a Document: Selectors
How Drilling and Selectors Work Together
How Links, Drilling, and Selectors Work Together
How to Use Selectors to Change the Data Displayed in a Document