Strategy ONE
Time Series Trend Analysis
Time series trend analysis is supported in Managed Cloud Enterprise and starting in MicroStrategy ONE (March 2024), on theManaged Cloud Government platform. You can only use this feature in Strategy Library (web browser only) and Workstation when you connect to a Library server.
Starting in MicroStrategy ONE (June 2024), users can visualize multiple trend lines in a single visualization. This update allows for a deeper data analysis which enables you to identify specific trends. It supports targeted decision-making and the ability to identify opportunities or issues specific to different attribute elements.
Use Auto Answers for Linear Trend Analysis
To get insights from linear trend analysis using Auto Answers, simply phrase your trend inquiry in everyday language. For instance, ask "What is the trend for Profit in the last year?" Auto Answers delivers a precise trend analysis based on your question, its comprehensive grasp of your dataset, and refined statistical methods. To include break by analysis, you can ask "What is the trend for Revenue over Date broken down by Category?".
Auto Answer's response consists of a clear natural language description of the observed linear trend alongside a trend line chart visualization, ensuring you have a clear perspective on the historical trend path. By incorporating the break by functionality in your trend analysis inquiries, you can easily obtain insights on trends specific to different attribute elements and ensure that you have a comprehensive understanding of the historical trend paths. The visualization is rendered to fit all data points from the input range into compact . This allows you to quickly glance through your data and better understand its relation to the trend line. To dive deeper into the result, the visualization's expanded mode found in top right corner.
Here's how you can delve into predictions using Auto Answers. Auto Answers is in expanded mode for the following examples:
-
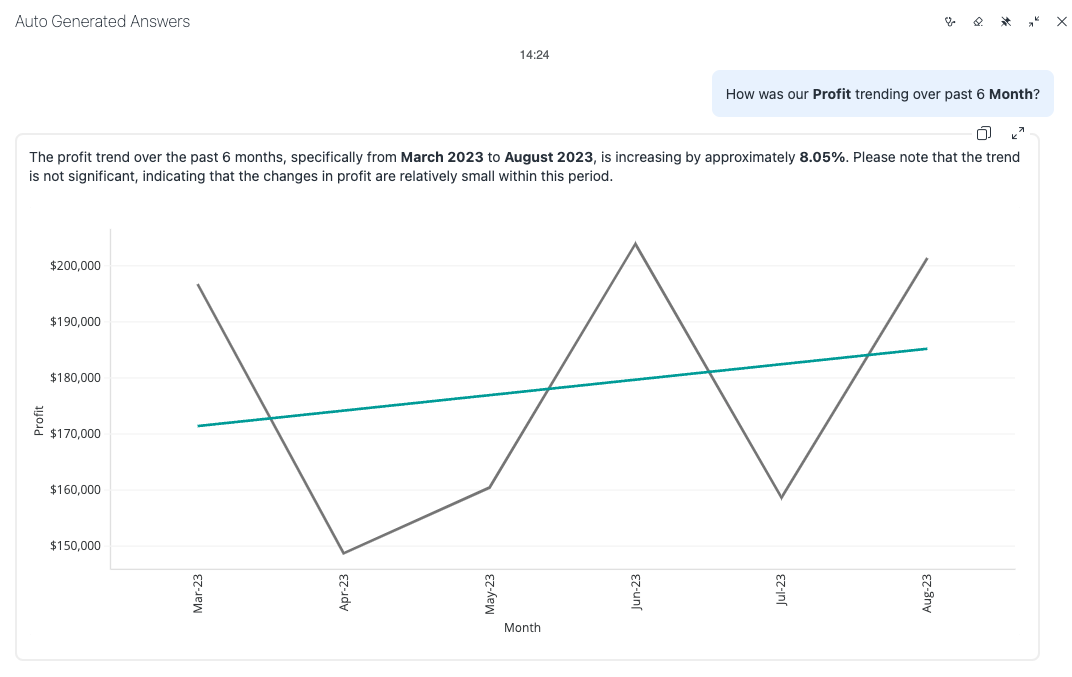
Last Few Months Trend Start with a given monthly sales dataset. You can ask Auto Answers to plot the sales trend for the last few months. The algorithm adeptly handles the task even if you're requesting a trend for an entire year based on monthly data.
Ask the question, "How was our Profit trending over past 6 months?"

-
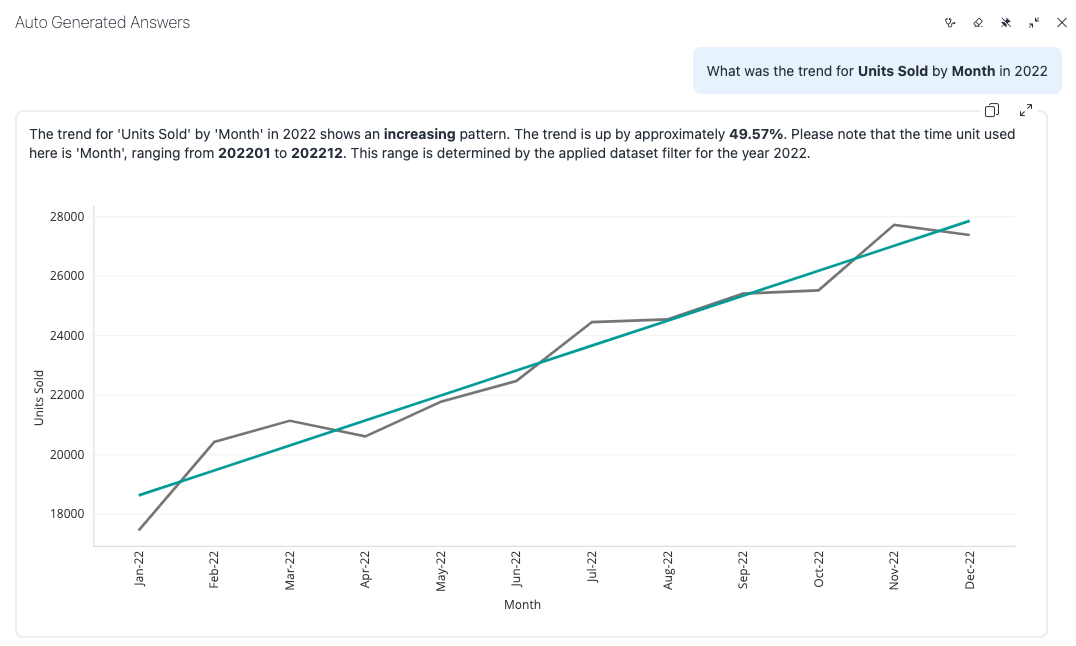
Trend Over Periods Auto Answers can also handle trend generation over time durations. Use historical monthly data to plot trend for past events.
Ask the question, "What was the trend for Units Sold by Month in 2022?"

-
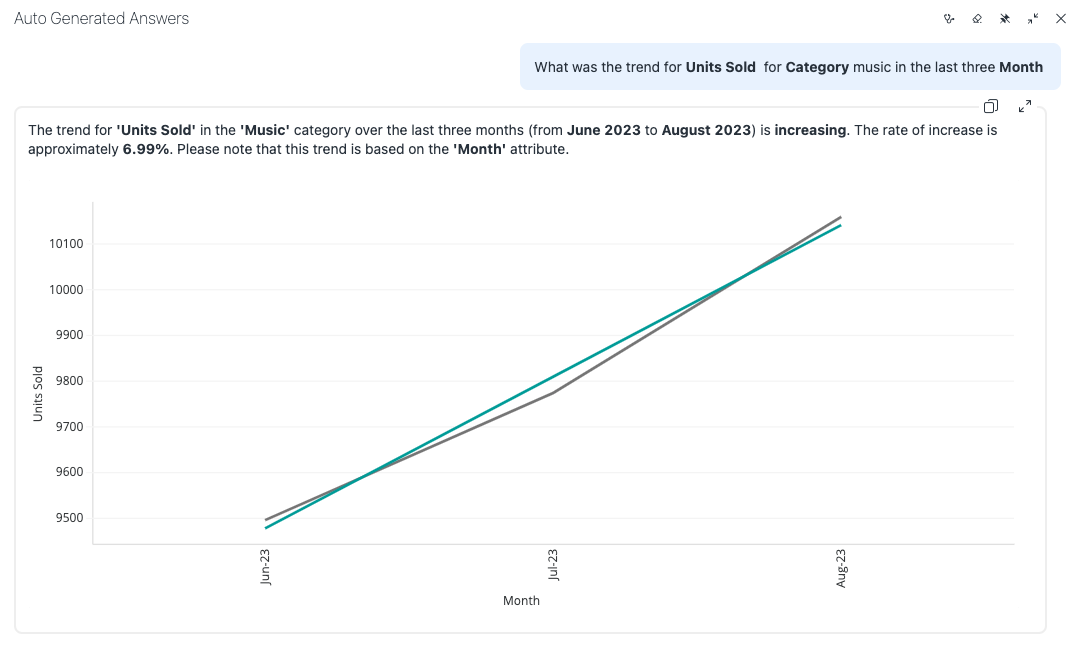
Applying Filters Trend Analysis can also be filtered. The example below demonstrates trend analysis for the last three months, considering a specific category like music. Keep in mind that the month attribute is represented as an integer, not a time-based value.
Ask the question, "What was the trend for Units Sold for Category music in the last three Month?"

