Strategy ONE
Modify a Document in Editable Mode
Editable mode allows you to view document data while you design it. You can format grid and graph reports, including metric values and attribute headers, unlike design mode. You can quickly see changes to the document. However, the performance is slower since all of the document results appear on the screen.
Let's display the report's title bar and enable quick switching in the report to display it as a grid or graph.
-
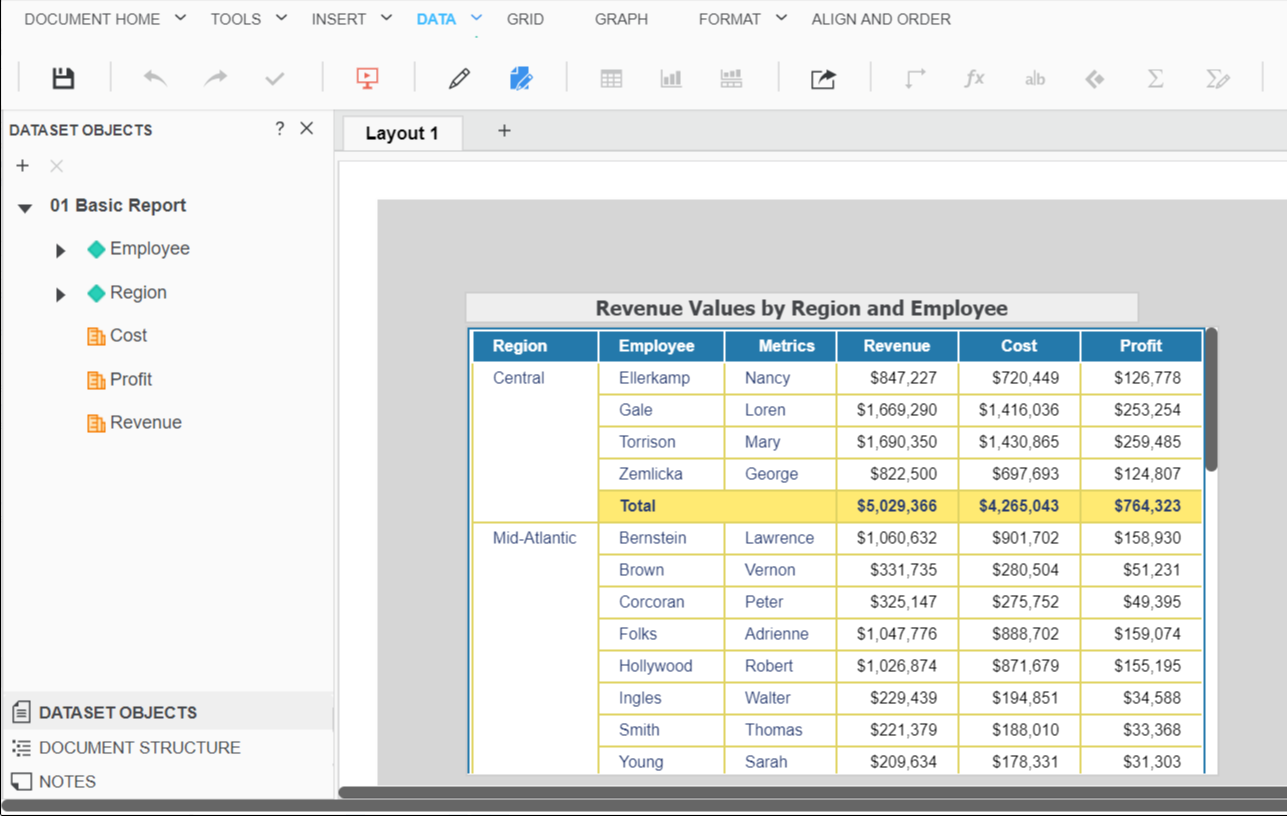
Click Editable Mode
 .
. Notice that the grid report results appear the same as in presentation mode. However, the Dataset Objects panel, menus, and the toolbar also appear.
- Click on the grid report.
- Click Select
 .
. -
Right-click and choose Properties and Formatting.
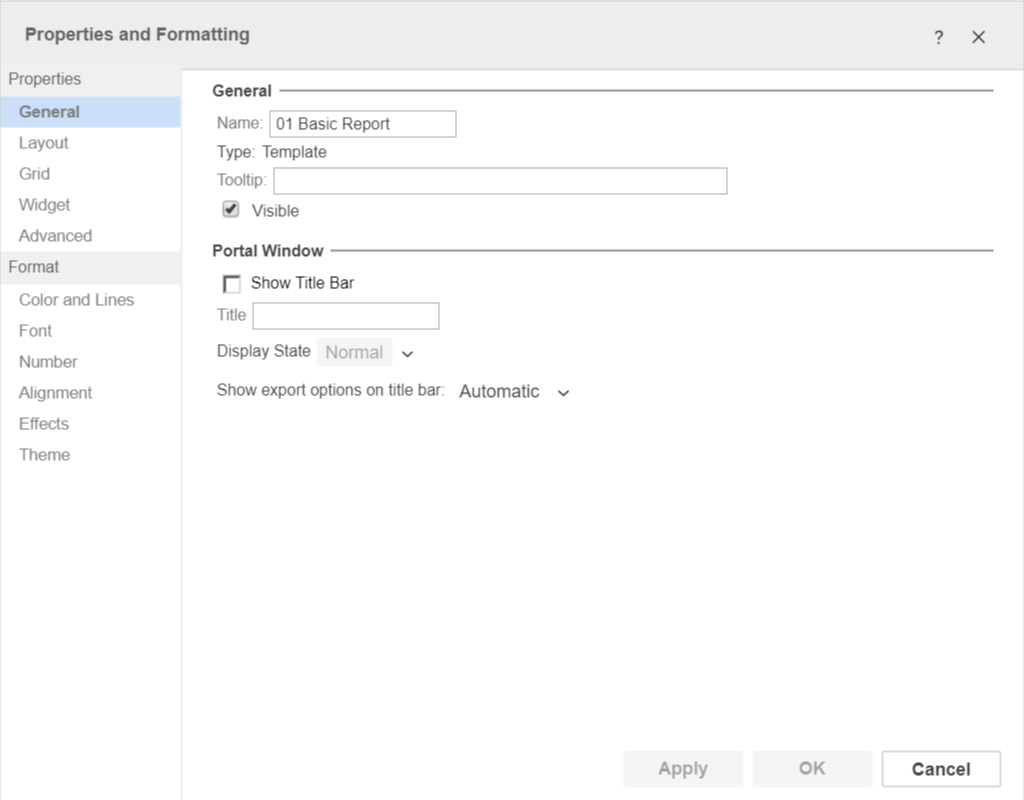
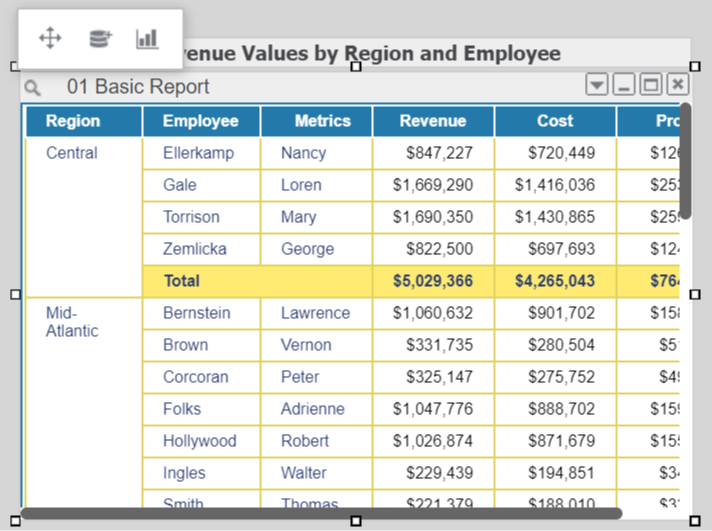
- Select the Show Title Bar checkbox. You are using the dataset name, which appears by default. If necessary, you can add your own title.
-
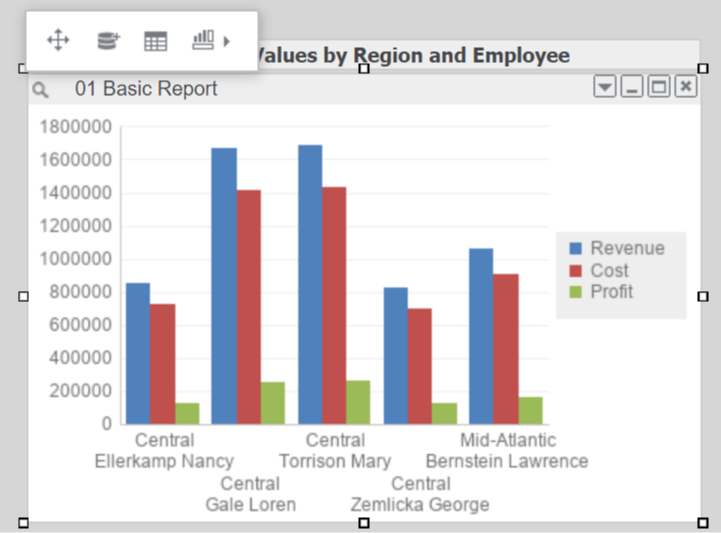
Let's enable quick switch. This allows you to view your report as either a grid or graph at the click of a button. In the left pane, click Layout.
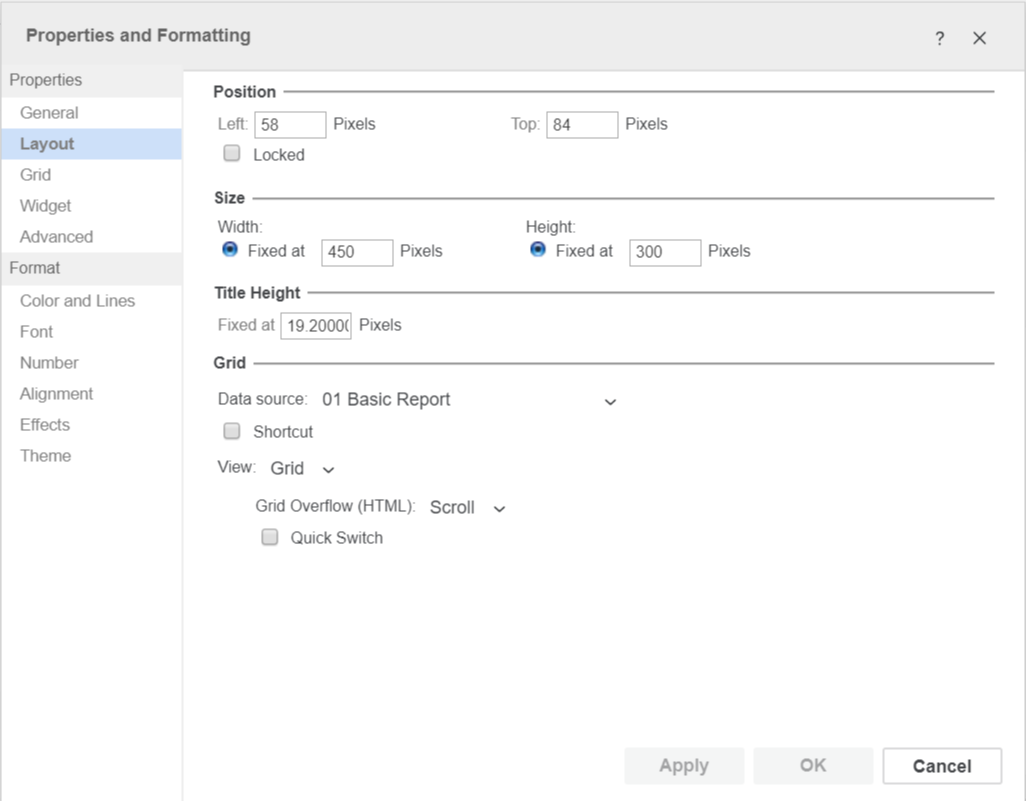
-
Enable the Quick Switch checkbox and click OK.
An additional button appears in the toolbar, so you can toggle the report display as a grid or graph.