MicroStrategy ONE

Use Auto Answers to Self Serve Insights

Auto Answers is supported in MicroStrategy Cloud Environments (MCE) using MicroStrategy ONE Update 11 or later and starting in MicroStrategy ONE (March 2024), Auto Answers is supported on the MicroStrategy Cloud for Government platform. You can only use Auto Answers in MicroStrategy Library (web browser only) and it is only available to subscribers of the MicroStrategy AI add-on bundle.

Starting in MicroStrategy ONE (March 2024), you can enrich your Auto Answer capabilities and accuracy by uploading a knowledge asset that provides context that is specific to your organization. Auto Answers can also answer compound, multi-faceted questions and adds support for questions across multiple in-memory datasets within a single dashboard. MicroStrategy ONE (March 2024) also adds Interpretation for a deeper understanding into how AI interprets and executes its queries which enhances transparency and insight in data exploration.

Starting in MicroStrategy ONE Update 12, Auto Answers includes faster response times and improved accuracy for business intelligence analysis and complex queries. Auto Answers also retains chat history while the dashboard session is running with a new confirmation step for clearing history and suggested questions are automatically translated based on a user's language preference setting.

Starting in MicroStrategy ONE Update 11, you can use Auto Answers to easily discover and understand key data insights visualized in your dashboard. Auto Answers goes beyond what has been displayed in your dashboard and offers even more valuable content that lies underneath. This tool is your personalized data helper that ensures you get the most out of your information.

Auto Answers is an AI-powered chatbot that transform how you interact with and understand your data. Auto Answers acts as a personalized data assistant within your organization, which allows you to quickly uncover and comprehend key insight presented in a dashboard. Beyond what is immediately visible to you, Auto Answers delves deeper to reveal valuable underlying content and ensures that you always harness the full potential of your data.

Disclaimer: MicroStrategy's GenAI products, including Auto Answers, use advanced and developing AI techniques for valuable insights. However, it is crucial to understand that similar to all AI systems, it can't assure a 0% error rate. In AI-driven analytics, uncertainties and complexities may lead to occasional inaccuracies. It is important to check AI-generated content for accuracy.

Check out the following topics to get started:

Prerequisites

  • You must have the Use Auto Assistant and ML Visualizations privilege.

  • Confirm the project level, application level, and dashboard level settings are turned on. For more information, see Enable and Disable Auto.

  • Project level setting:

    Application level setting:

    Dashboard level setting:

  • Starting in MicroStrategy ONE (March 2024), optionally upload an Excel file in Dashboad Properties. For more information, see Upload Knowledge Assets to Auto Answers.
  • Starting in MicroStrategy ONE (March 2024), dashboards support multiple in-memory datasets. Prior to MicroStrategy ONE (March 2024), dashboards only support single in-memory cubes.

    Live connect datasets are not supported.

Using Auto Answers

  1. Open MicroStrategy Library.

  2. Create a new dashboard or open an existing dashboard.
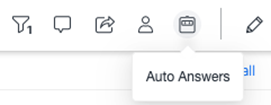
  3. Click the Auto Answers icon in the upper-right.

  4. Use the text box in the lower-right to ask Auto Answers a question that targets the underlying dataset and click the blue envelope icon. Alternatively click one of the suggested questions. The suggested question option is useful for users seeking assistance to get acquainted with the content faster.

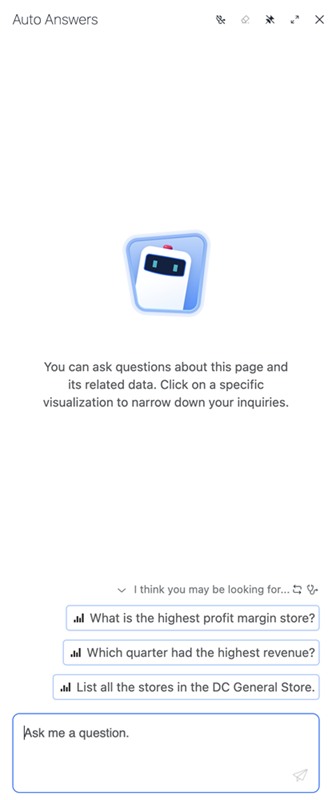
    • Questions are limited to 1000 characters.
    • By default, answers are based on the information displayed on the dashboard page. To narrow your results, click a visualization, then ask your question. When you click on a visualization before you ask a question, Auto Answers responses are derived based on the visualization's filter. Additionally, starting in MicroStrategy ONE (March 2024), if your selected visualization is influenced by an in-canvas selector, Auto Answers response incorporates the selector criteria and filters the results based on your selection.

    • If you ask about data that is not present in the chosen visualization, the answers may be misleading. In such instances, MicroStrategy recommends that you remove the visualization from the chat context for more accurate answers.

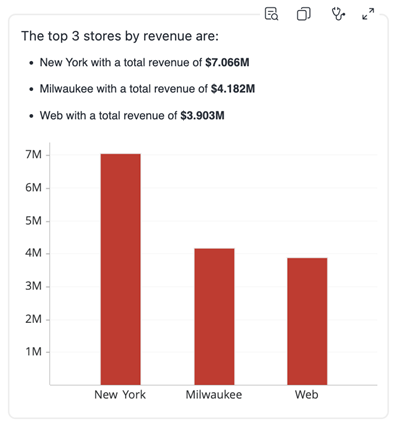
  5. Once Auto Answers responds, you can click the relevant icon to maximize the visualization to full screen or copy the response to your clipboard.

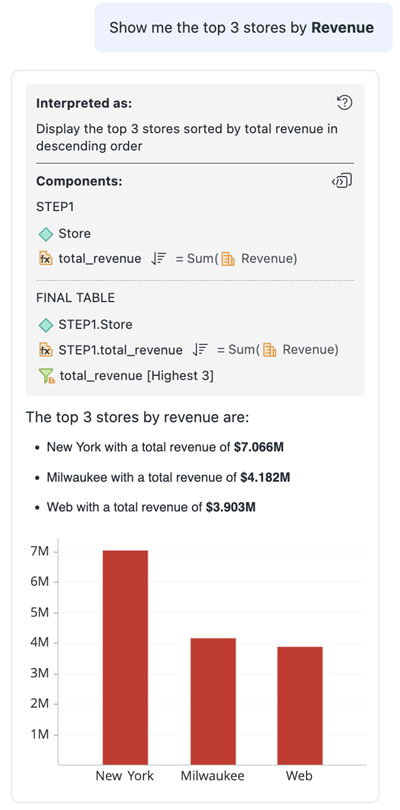
  6. Starting in MicroStrategy ONE (March 2024), click the Interpretation icon for insights on how Auto Answers interpreted and executed your question. The extent of information that displays in the Interpretation window varies on your user privileges. For more information, see AI Interpretation and Execution.

Understanding the Response

Auto Answers provides responses comprised of natural language text and when valuable, accompanying visualizations. Auto Answers supports a range of visualization types, including grids, vertical bar charts, pie charts (ring charts are not supported), line charts, KPIs, heat maps, geospatial service (mapbox), key driver analysis, and insight line charts for trend and forecasting analysis. If you ask a question that requires specific visualizations, ensure that the chosen visualization type is one of the above supported visualization types.

The response will also be accompanied by a navigation panel. Hover over a response and in the top right corner, select an icon to do one of the following:

  • Copy the response to your clipboard
  • You can only copy the text of a response.

  • Maximize the visualization to view it in full screen

If the Auto Answers response includes many data points, the visualization will display a condensed version with limited data to focus on clarity and readability. This condensed display often applies to bar charts, key drivers, and time series visualizations. You can view the complete set of data points when you maximize the visualization.

When asking questions in Auto Answers, you might notice variations in the narrative or visualization types for the same query, while the numerical data remains accurate. For example, a "Which stores had consistent improvements in revenue?" query may result in slightly different summaries during different sessions but the list of stores are consistent. This variation is due to the non-determinstic nature of the Large Language Model (LLM), which aims to provide the most relevant and accurate response each time you ask a question, even if it has to alter the approach.

Navigating the Auto Answers Panel

The Auto Answers panel displays your questions and answers. You can use the panel to improve your Auto Answers experience.

Pin

Fit the dashboard page content on the canvas to avoid overlapping the panel. You can click this icon again to turn it off. When you pin Auto Answers, it retains its position next to the dashboard and its content when you use title bar options such as, bookmarks, filters, and Account management.

Maximize

Once you pin the chat panel to the dashboard, you can also select maximize to view it in full screen for a more focused interaction.

Clear Chat History

  1. Click the clear history icon and start a new chat.

  2. Starting in MicroStrategy ONE Update 12, click Yes, when prompted.

Each page of a dashboard maintains its own chat history, which allows you to revisit conversations. When you switch between different pages, a new chat session starts for each page. When you return to a previous page, the page specific chat history appears. The chat history remains until you clear the chat history or exit the dashboard. This behavior ensures a seamless and relevant experience based on the page you are viewing.

Understanding the Question Limits

You can ask a question that is up to 1000 characters at a time.

Auto Answers can answer questions about metrics placed on the current page with panels that are currently selected and all available attributes in a dataset.

  • However, due to the size of the data or the complexity of the dataset (for example, the number of datasets, the number of attributes and metrics, and the object name length), the AI service may reach the computational limit, which cannot be increased. In this case, for every subsequent question, Auto Answers will make the following suggestions in order of priority:
    • Auto Answers will suggest metrics placed in the current page and selected panels, and attributes that are placed in visualizations used in the dashboard.
    • Auto Answers will suggest metrics and attributes placed on the current page with panels that are currently selected.
  • With this logic, while restrictive, you can minimize errors in responses due to computational limitations and maximize your experience.
  • If you clear the chat history, the logic sequence is reset to its default size.

Answering Compound, Multi-faceted Questions

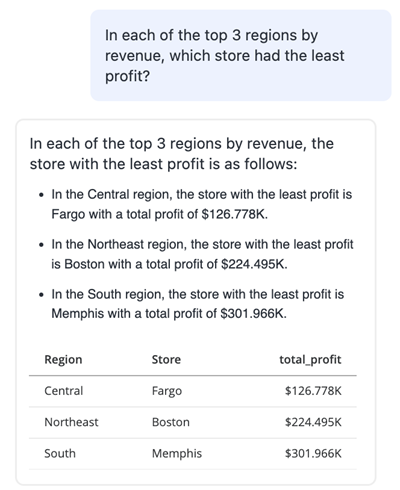
Starting in MicroStrategy ONE (March 2024), you can receive effective responses to compound, multi-faceted questions that span across multiple datasets in a dashboard. For example, you can ask "In each of the top 3 regions by revenue, which store had the least profit?". This update allows deeper, contextually rich insights drawn from multiple data points within the same question. In the previous example, Auto Answers computes the three regions with the highest revenue growth, then identifies the individual store with the lowest profit in each of the regions. Auto Answers then combines the responses from previous steps to display the final response.

Consider the question "Which 2 categories had the highest Profit growth between Q1 and Q2 2019?". This question unfolds in multiple layers. Initially, Auto Answers pinpoints all categories' profit for both quarters then it calculates the growth rates, and finally, ranks them to identify the top two categories. This methodology is better understood for every question when you expand the Interpretation window, where the multi-step execution is explained.

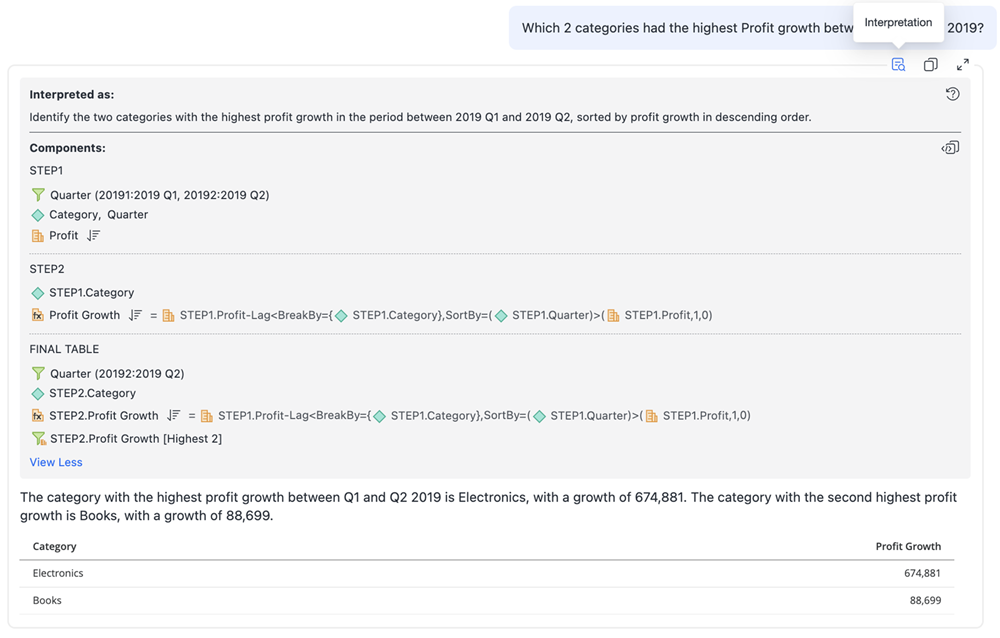
For more information about Interpretation, see AI Interpretation and Execution.

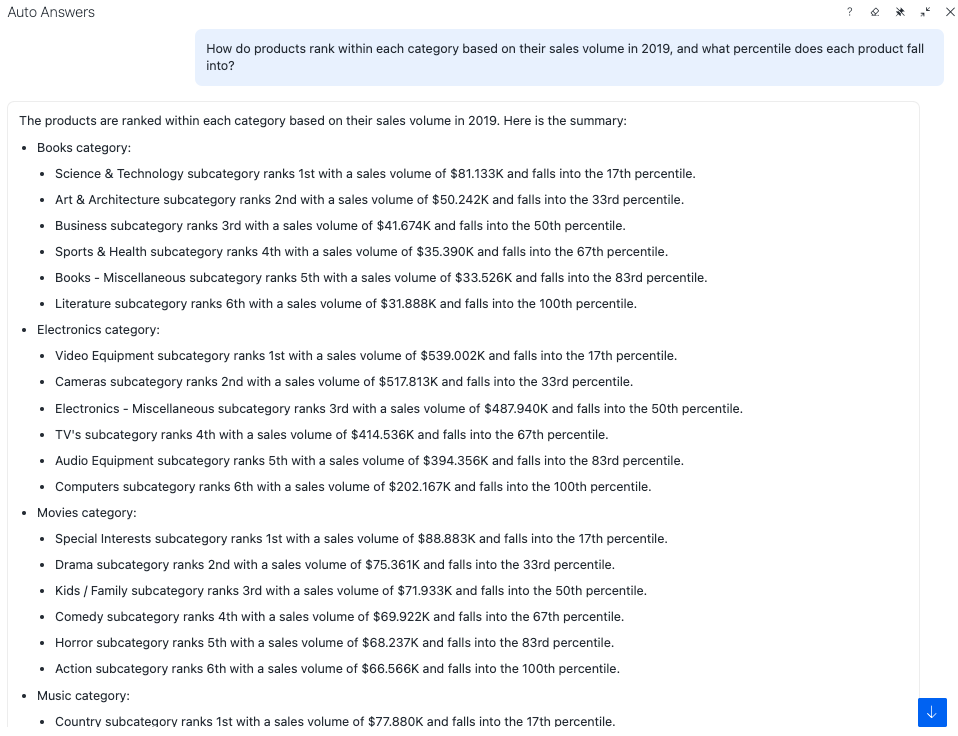
To expand on Auto Answers's capabilities to answer more complex questions, the following example demonstrates the ability to execute rankings and percentile calculations within groups. If you ask "How do products rank within each category based on their sales volume in 2019 and what percentile does each product fall into?". Auto Answers ranks products within each category by sales volume, then it determines each product's percentile rank, and offers a comprehensive overview of performance within the categories.

This capability empowers business users and analysts to extract multi-dimensional insights with a single question and look deeper into their data to uncover trends, anomalies, and relationships across various datasets. It enhances decision-making efficiency and provides contextually relevant insights in a conversational analytics setting, without extensive data manipulation.

Best Practices

For Authors

  • Do not include an excessive number of objects and long names in datasets.

  • Ensure each dataset, attribute, and metric has a unique name to avoid confusing the AI analysis and for clarity when users select an auto-complete option.

  • Avoid including object names such as "This week" or "Last week". If this name is essential, ensure that you use auto-complete when posing questions to Auto Answers. This helps Auto Answers determine the object name rather than using the current week timeframe.

  • Custom Groups, Consolidations, and Derived Elements are not supported.

  • Avoid using special characters in datasets such as '%', '*', ':', etc. For more information on data transformations, see Data Wrangling Dialog or Replace function. Similarly, accommodate your dataset metric convention in the same manner.

  • Avoid using Time-series attributes in DateTime form for a Time related attribute.

    • You can convert the column separate Date and Time attributes.

  • Avoid multiple Attribute objects from datasets that represent the same business entity. For example, avoid a dataset with an attribute named Week with a MM/DD/YYYY format and a integer datatype named "Week".

  • Compound grid authors may apply identical aliases to multiple objects. However, if the dashboard is intended to be accompanied by Auto Answers, refrain from applying identical aliases and ensure that each object has a unique alias.

For Consumers

  • Ask questions related to the information in the dashboard or dataset. Auto Answers is designed as an AI Assistant to analyze and offer insight specifically from the data in your dashboard. Auto Answers is not equipped to answer questions outside your dataset or dashboard.

  • For accurate and complete responses, ask only one question at a time. Avoid combining multiple questions into one. For example, "What is the total COST for each Quarter? Which Quarter has the highest PROFIT?".

  • Avoid asking repetitive questions.

  • Auto Answers interprets questions with higher accuracy when you list Semantic Graph objects. User-typed questions are enabled with auto-complete suggestions so you can select MicroStrategy objects before you submit a question.

  • When your data spans multiple years, be specific when you ask a question to ensure accurate responses. For example, instead of "What was the total revenue in Q2?", use "What was the total revenue in Q2 2023?".

  • Ensure you use precise element names when constructing your questions. For example, if an element named "Product SKU: ABC123" is in your dataset, you should use that exact element name instead of a variation such as, "Product ABC123" or "SKU:ABC-123". This practice ensures that Auto Answers accurately identifies the data you are referencing and results in more precise and dependable responses.

Common Issues

See the following issues that you can encounter and the best practices to avoid them.

The question's context is too complex to be processed

When you submit a question to Auto Answers, there is a possibility that the data input limit will be reached before returning an answer. If that happens, you receive the following response: The dashboard definition is too large to use Auto, please refine the datasets and dashboard before trying again.

Multiple factors can impact the weight of the question:

  • The number of objects in the dashboard, dashboard page, or datasets.

  • The name of a Semantic Graph. The number of words in an object name impacts the complexity of the question.

Best Practice

  • Authors should review the functionality and performance of Auto Answers prior to release and consider the common business cases and typical questions a user will ask.

  • Authors should simplify their datasets for Auto Answers by reviewing, reducing complexity, and content density. Authors should adopt a clear naming convention and create a lighter version of the dataset to enhance usability with Auto Answers for users.

  • Users can limit the scope of questions to what is displayed on the page.

Multiple Questions

If you ask Auto Answers multiple questions in one questions, the response may only address one question, answer both questions partially, or misinterpret the question.

For example, if you ask "Which Store had the highest Revenue and which product category had the lowest profit margin?", Auto Answers might accurately identify the top revenue store but may not address the profit margin.

Best Practice

Avoid asking multiple questions in one question. Focus on one question at a time, the more specific the question is, the more accurate the result is.

Answering Non-Aggregatable Values

You can occasionally encounter unexpected responses from Auto Answers, even when you use accurately formulated questions. This often occurs due to certain metric definitions and aggregation functions. When metrics are not designed for dynamic aggregation and are queried, the resulting calculation can lead to misleading, erroneous, or null values. For example, when a metric, such as annual population figures, is queried without specifying the necessary dimensions (for example, the year), an inaccurate aggregation of data over time can occur.

For example, if a question does not consider Year, a response from Auto Answers yields skewed results and totals the population value across all years in the dataset. The image below displays the correct value on the left and the incorrect value on the right:

Best Practice

For accurate responses to queries that include non-aggregatable values, use non-aggregate metrics that are based on the MicroStrategy project schema in your dashboard. Non-aggregate metrics, such as inventory calculations, are prevalent in Retail verticals or Banking sectors. In applications powered by the project schema, Auto Answers processes the metrics at the correct level of aggregation and respects non-aggregatable settings, where defined, to provide reliable and precise answers.

For example, if you ask "In December 2020, what was the End on hand inventory level of Discman?", Auto Answers will correctly provide the end-of-month inventory, without summarizing it across the proceeding months.

Related Topics

Auto Adoption

AI Interpretation and Execution