Strategy One
Introduction to Analyzing Data in a Time Series Slider Widget
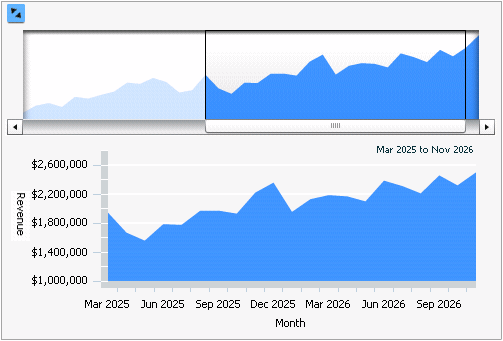
A Time Series Slider widget is an area graph that allows you to choose which section of the graph to view at a time. The widget consists of two related graphs, one positioned above the other.
- The top graph is the controller, where you move the slider to choose which section of the primary graph to view.
- The bottom graph is the primary graph, and it is updated automatically when you use the slider in the controller.
This is a Flash-based widget, which displays in Flash Mode. For newly created documents, Flash Mode is deprecated and replaced by Presentation Mode. In Presentation Mode, a Flash-based widget is hidden or is displayed as a grid, a graph, or a placeholder showing a message, as set by the document designer.
Time series data can be long and require analysis from both a high-level and a detailed view. The Time Series Slider widget allows you to focus on the details of a short range of time, and then expand the time range to see trends over time. The Time Series Slider widget displays values for only one attribute, which is usually time-based, to limit the amount of data viewed at one time.
In the Time Series Slider graph:
- The X-axis represents the attribute. In the example below, this is the Month attribute.
-
The Y-axis represents the metric. In the example below, this is the Revenue metric.

To analyze data in a Time Series Slider widget:
- To determine which part of the graph to view, use the scroll bar at the top of the widget to adjust the slider's position.
- To determine the range of graph values to view, drag the left or right edge of the slider at the top of the widget to adjust its size.
- To hide (or show) the graph controller, select the Expand/Collapse button at the top left of the widget.
- If the document contains a grid, graph, or panel stack that is connected to this widget, use the Time Series Slider controller and primary graph to display related data in connected grids, graphs, and panel stacks.
Some features described above may not be enabled in all documents.
A Time Series Slider widget can be combined with an interactive selector so you can change the attributes that are displayed in the widget. For example, you can select the Southwest region to have the Time Series Slider widget display the Revenue values for Southwest, in the time frame selected in the widget.
