MicroStrategy ONE
Using page-by on a document
You can use page-by to interactively display groups on separate pages of the document. This is useful when a document returns a very large set of data in its results. Analysts can use page-by when viewing the document in MicroStrategy Web or when viewing the PDF version of the document.
Page-by allows the end user to select and dynamically display elements from a grouping field as criteria for analysis. The PDF that results from this selection is called a page of the original document. By displaying different criteria for analysis, pages provide an added level of data manipulation and display.
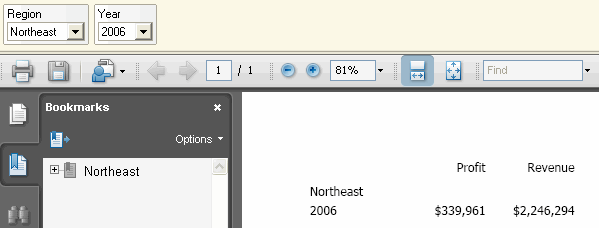
For example, a document displays revenue and profit data and is grouped by Region and then Year. By default, both Region and Year are included in the page-by field at the top of the document. Analysts can select a specific region and year from the page-by field, to display the data for the selected region and year combination. The following sample shows the data for the Northeast region in 2006.

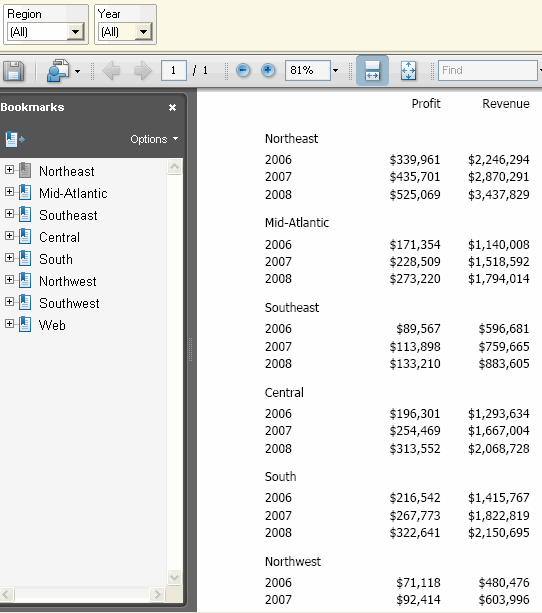
You can also see the data for all years for a particular region or all data in the document, regardless of region or year. The following sample shows all the data in the document.

Page-by is automatically enabled when you use grouping fields as part of your organization of a document's data. You can group data based on attributes, consolidations, and custom groups. You cannot page by metrics.
If you display totals for a group, an option named Total is displayed in the drop-down menu for that group when the document is viewed as a PDF. For examples of group totals and steps to display them, see Showing totals for a group.
You can control how the page-by is exported to Excel or PDF, by choosing whether to export only the current page-by selection or the whole document. For more information, see Formatting a document for export.
