MicroStrategy ONE
Year-To-Date Transformation Example
You need to compare the number of units sold today to the number of units sold from January 1 through today. Create a metric that sums the fact Units Sold. Create a second metric identical to the first, but add the predefined Year to Date transformation. This metric definition is shown below:
Sum([Units Sold]) {~+} | [Year to Date] |
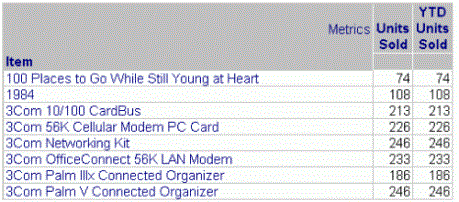
Place the two metrics on a report with the Item attribute. A sample of the results is shown in the following image, sorted by Item.

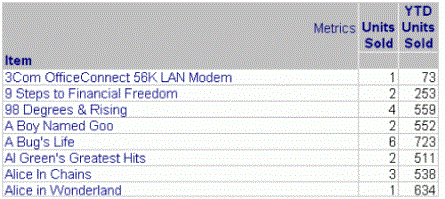
The Units Sold and YTD Units Sold metrics calculate the same value. Why? The transformation has not been given a date to transform, so both metrics calculate the number of units sold for all time. In the transformation example at the beginning of this section, with the number of Web visitors, the report contained the Date attribute and a filter on time. To correct the problem using this current example, add a report filter that prompts the user for a specific date. If a user answers 9/21/2024 to the prompt, the report returns the following:

The Units Sold metric returns the number of units sold on 9/21/2024, while the YTD Units Sold metric calculates the units sold from 1/1/2024 until 9/21/2024.
If you re-create these reports, be aware that the years and data have been updated in MicroStrategy Tutorial; the reports will not display the same values as the samples.
