MicroStrategy ONE
Order of Layers
With the different types of formatting, it is important that the interaction between them is clearly defined so that display and order of processing is correct. Each succeeding layer overwrites the formatting of all its preceding layers, as shown below.
This section provides a list of all formatting types, as well as a table of each type of formatting and what formatting it overwrites.
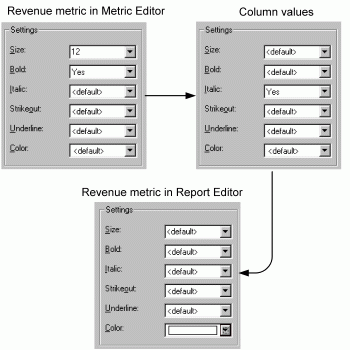
The Basic Report, shown below, contains the Revenue metric. Use the Metric Editor to change the metric header to a bold, 12-point font. Wherever this metric is used, this header font is applied. Execute the report. The Revenue metric header appears the same as the other metric headers, because other formatting layers already set in the report overwrite the metric level formatting.
Italicize the column values and change the other font settings to default. Change the Revenue metric header to a white font. Since the Format menu in the Report Editor is used for this change, the new format applies to the current report only. The formatting dialogs for each are shown below.

The completed report looks like the following:

The final formatting for the Revenue metric header is a combination of the formats of the metric level header (set in the Report Editor), the column values, and the report metric.
The following list describes all the formatting layers in the order that they are applied, starting with the first layer to be applied:
- Metric specifies a format for the particular metric, regardless of the report it is on. This formatting, which can be applied to headers and values, is performed in the Metric Editor. Metric level formatting is overwritten by axis and all metrics formatting. Setting those layers to default allows the metric level formatting to display.
To format metric values at the metric level, the all metrics values formatting must be default. To use it for metric headers, set the axis headers formatting to default.
- Axis formatting affects all the units of the axis. This zone formatting is overwritten by grid unit formatting. The axis formatting layers are located under the Rows and Columns options on the Format menu.
- Metrics label formatting applies to the text "Metrics" that is displayed on the report. It is based on the axis header formatting. For example, if the metrics are displayed on the columns of the report, then the formatting for column headers is applied to the label "Metrics".
- All metrics formatting has two options:
- All metrics headers formats the metric names. It overwrites the axis formatting.
- All metrics values formats the data zone, or where the metric values are displayed. It overwrites metric level formatting.
The Format menu contains the All Metrics option.
- Report metric formats an individual metric on a particular report. It does not change the formatting of the metric in other reports. Report metric formatting overwrites metric level and all metrics formatting. To format a metric at the report level, select the metric on the Format menu.
- Grid unit allows you to format an individual report item, such as an attribute. It overwrites axis formatting. Every grid unit is listed on the Format menu.
- Banding enables row or column grouping by color to enhance readability. Banding formats are applied before subtotal formatting to allow subtotals to take priority. Select Grid, then Options to create banding.
- Column subtotals formatting is overwritten by row subtotals when column and row subtotals intersect. Subtotal formatting can be applied as either zone or grid unit formatting:
- In grid unit formatting, the formatting moves with the subtotals. Every grid unit is listed on the Format menu.
- In zone formatting, formatting is based on location. To format subtotals as a zone, select Columns from the Format menu, then choose Subtotal Headers or Values in the drop-down menu.
The subtotal headers lie on the values zone. Formatting is applied on subtotal headers in the following order, starting with the first layer to be applied:
- Axis values
- Axis subtotal header
- Template unit values
- Template unit subtotal header
- Row subtotals formatting takes precedence over column subtotals when the two intersect. As with column subtotals, it can be applied as either zone or grid unit formatting.
The subtotal headers lie on the values zone. Formatting is applied on subtotal headers in the following order, starting with the first layer to be applied:
- Axis values
- Axis subtotal header
- Template unit values
- Template unit subtotal header
- Custom group formatting allows you to format each custom group element differently, independent of the report format. Set this format in the Custom Group Editor.
- Consolidation elements can also be formatted individually. This formatting applies to any report the consolidation is placed on. To format a consolidation, use the Consolidation Editor.
- Report border creates a border around the whole report.
To set a report border, right-click the report but not a report object. Select Formatting, then Grid Borders.
- Threshold is the last layer applied so it overwrites all other layers.
The following table contains a matrix of each formatting layer and the layers that overwrite it.
This layer...
Is overwritten by these layers...
Metric object - headers
Axis headers, grid unit headers, all metrics headers, report metric headers, column subtotal headers, row subtotal headers
Metric object - values
Axis values, grid unit values, all metrics values, report metric values, banding, column subtotal values, row subtotal values, custom group values, consolidation values, thresholds
Axis - headers
Grid unit headers, all metrics headers, report metric headers, column subtotal headers, row subtotal headers
Axis - values
Grid unit values, all metrics values, report metric values, banding, column subtotal values, row subtotal values, custom group values, consolidation values, thresholds
All metrics - headers
Report metric headers, either the column subtotal headers (if the metrics are in the columns) or row subtotal headers (if the metrics are in the rows)
All metrics - values
Report metric values, banding, column subtotals, row subtotals, custom group values, consolidation values, thresholds
Report metric
Banding, column subtotals, row subtotals, custom group values, consolidation values, thresholds
Grid unit - headers
Column subtotal headers, row subtotal headers
Grid unit - values
Banding, column subtotal values, row subtotal values, custom group values, consolidation values, thresholds
Banding
Column subtotals, row subtotals, custom group values, consolidation values, thresholds
Column subtotals
Row subtotals, thresholds
Row subtotals
Custom group values, consolidation values, thresholds
Report border
None
Custom group - headers
Consolidation headers, thresholds
Custom group - values
Consolidation values, thresholds
Custom group child - headers
Consolidation headers, thresholds
Custom group child - values
Consolidation values, thresholds
Consolidation - headers
None
Consolidation - values
Thresholds
Thresholds
None
Order of Layers for Metric Headers Displayed Under the Parent Subtotal Headers
The metric headers on a report may be displayed under the parent subtotal header (the parent subtotal is the attribute). For example, if both the attributes and the metrics are placed in the columns, the metric is displayed below the attribute subtotal, as shown below:

If both the attributes and the metrics are placed in the rows, the metric is displayed to the right of the attribute subtotal, as shown below:

When the metric headers are displayed under the parent subtotal header, the formatting is applied to the metric header in the following order:
- Grid unit formatting of the template unit object for its parent subtotal element, with all regular rules for grid formatting applied
- Metric header
- Column or row subtotal formatting
Therefore, the metric header formatting in the subtotal column or row is inherited from the parent subtotal header formatting only if the subtotal formatting is not set to default.
For example, the Year subtotal header and values have been formatted to display white text on a black background, as shown below. The metric header (the word Profit) in the subtotal column is formatted the same as the Year subtotal header.

If the Year subtotal header formatting is set to default instead, then the metric header formatting in the subtotal column is inherited from the metric header. This is shown below, where the Year subtotal header and metric header are displayed in blue text on a gray background, just as the other headers are.

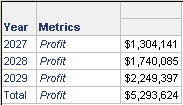
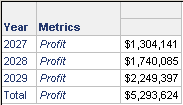
The same formatting order applies when the report contains the attributes and the metrics in the rows. When the subtotal header formatting is set to default, then the metric header formatting is inherited from the metric header. In the example below, the metric header is italicized, but the subtotal header is set to default. Thus the metric header in the subtotal row (the word Profit in the Total row) inherits the formatting from the metric header and is italicized.

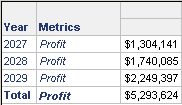
Change the formatting of the Year subtotal header to bold text. The metric header in the subtotal row (the word Profit in the Total row) now displays in a bold italicized font. The italics are inherited from the metric header, since all the font options of the subtotal header are set to default.

