MicroStrategy ONE
Elements of a Metric Level
The following elements are needed to specify a level for a metric:
- Target: the Context of a Calculation
- Grouping: How Aggregation is Performed
- Filtering: How the Report Filter Interacts with the Metric Calculation
These elements are set in the Metric Editor. The window displays the complete metric definition, including its formula, level, condition, and transformation. In the metric definition area, selecting Level (Dimensionality) causes the Level (Dimensionality) component window to appear below.
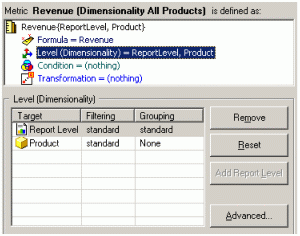
Clicking Reset changes the level unit back to the default of report level for the target and standard for filtering and grouping. The Add Report Level button becomes available if the report level is removed from the metric level.
The Advanced button accesses the Level (Dimensionality) advanced options dialog box, which is discussed in Level Metrics: Applying the Metric Condition to the Metric Calculation and Level Metrics Accepting Dimensionality Units to Emulate MicroStrategy 6.x Behavior.
Target: the Context of a Calculation
The target is the attribute level at which the metric calculation groups. It determines the table to use to calculate the metric. Any set of attributes or a hierarchy can be the target. A special case is the default target, which is at the report level. For a more detailed description of the report level, including an example, see Report Level: Interaction with the Context of Reports. For specifics on using a hierarchy as a target, see Using a Hierarchy as the Target of a Metric Level.
The following examples use attributes as the target; for an example using a hierarchy, see Level Metrics Review: Standard Grouping.
In a Revenue (Dimensionality All Products) metric, the target is Product.
The target is indicated between braces in the metric definition, as shown below:
Sum(Revenue) {~, Product}
Grouping: How Aggregation is Performed
Groupingdetermines how the metric aggregates. The result of this setting is reflected in the GROUP BY clause of the SQL command. The grouping options for levels include:
- Standard: groups by the attribute level of the target. The metric calculates at the level of the target, if possible.
- None: excludes the attribute in the target from the GROUP BY clause. It also excludes any of the target attribute's children.
None is not an option if the target is set to the report level.
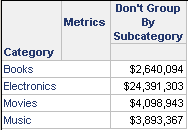
A revenue metric is defined as:
Sum(Revenue){~, Subcategory}
The level target is set to Subcategory, with standard grouping. When this metric is placed on a report with the Subcategory attribute, the report results are shown below.
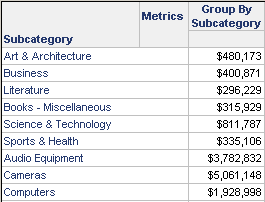
Notice that the sales are calculated for each subcategory, because the metric is grouping at the subcategory level, as shown in the SQL:
select a11.[SUBCAT_ID] AS SUBCAT_ID,
max(a12.[SUBCAT_DESC]) AS SUBCAT_DESC,
sum(a11.[TOT_DOLLAR_SALES]) as REVENUE
from [CITY_SUBCATEG__SLS] a11,
[LU_SUBCATEG] a12
where a11.[SUBCAT_ID] = a12.[SUBCAT_ID]
group by a11.[SUBCAT_ID]
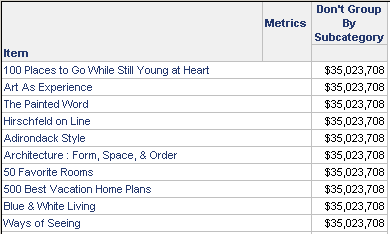
Using the same metric on a report with the Item attribute, however, yields the following results.
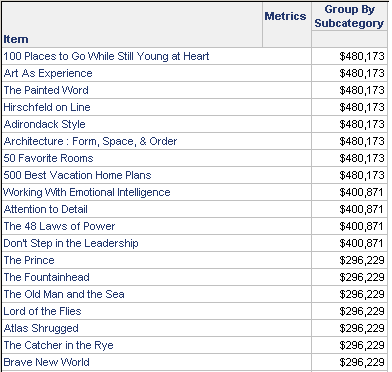
Although each item is listed, the value for each item in a given subcategory is the same. The metric is calculating revenue by subcategory, based on the grouping level defined in the metric. The SQL for this report is, in essence, the same as the previous example:
insert into TEMP_TABLE
select a11.[SUBCAT_ID] AS SUBCAT_ID,
sum(a11.[TOT_DOLLAR_SALES]) as REVENUE
from [YR_CATEGORY_SLS] a11
group by a11.[CATEGORY_ID]
select a11.[SUBCAT_ID] AS SUBCAT_ID,
a11.[SUBCAT_DESC] AS SUBCAT_DESC,
pa1.[REVENUE] as REVENUE
from [TEMP_TABLE] pa1,
[LU_SUBCAT] a11
where pa1.[CATEGORY_ID] = a11.[CATEGORY_ID]
Change the grouping to none on that same revenue metric and place it on a report with Category. Because Category is a parent of Subcategory, the metric can roll up to the Subcategory level. The report and its SQL are illustrated below.
select a12.[CATEGORY_ID] AS CATEGORY_ID,
sum(a11.[TOT_DOLLAR_SALES]) as REVENUE
from [CITY_SUBCATEG_SLS] a11,
[LU_SUBCATEG] a12,
[LU_CATEGORY] a13
where a11.[SUBCAT_ID] = a12.[SUBCAT_ID] and a12.[CATEGORY_ID] = a13.[CATEGORY_ID]
group by a12.[CATEGORY_ID]
A more efficient method is including a total category sales fact table in the project. Instead of adding all the subcategories together, the category total could have been pulled directly from that table. However, having Subcategory in the level of the metric forces the report to use the subcategory sales table.
If the same revenue metric, with the grouping set to none, is used on a report with Item, the report results are shown below.
The metric calculates the same number for each item—the total for all the items included on the report. Because Item is a child of Subcategory, Item is excluded from the group by clause:
insert into TEMP_TABLE
select sum(a11.[TOT_DOLLAR_SALES]) as REVENUE
from [CITY_SUBCATEG_SLS] a11

select a12.[ITEM_ID] AS ITEM_ID,
a12.[ITEM_DESC] AS ITEM_NAME,
pa11.[REVENUE] as REVENUE
from [TEMP_TABLE] pa11,
[LU_ITEM] a12

drop table TEMP_TABLE
Grouping Options for Nonaggregatable Metrics
The remaining grouping options are only used for nonaggregatable metrics. A nonaggregatable metric is one that should not be aggregated across an attribute. An example is an inventory metric. While the data warehouse records the inventory every month, these monthly numbers are not added together to calculate the yearly inventory. Instead, you may want to use the end-on-hand and beginning-on-hand inventory numbers to see how the total inventory changed over the year. These grouping options, described below, are used in such cases:
- Beginning lookup uses the first value of the lookup table.
- Ending lookup uses the last value of the lookup table.
- Beginning fact accesses the first value of the fact table.
- Ending fact accesses the last value contained in the fact table.
Setting a metric level to one of the options listed above defines the metric as nonaggregatable. Whether you select a fact or lookup table largely depends on how the necessary information is stored. For example, to find the beginning-on- hand inventory for a particular item, you need to know how the inventory information is stored. If the inventory count is not taken on the first day of the week, as the lookup table requires, the inventory count should be taken from the fact table for the first recorded entry.
There is another important difference between accessing a fact table and a lookup table. If a value, such as April sales, is missing from a fact table, the row still exists in the table and is reported as null or zero. If that same value is missing in a lookup table, the April row does not exist. The previous or next value (March or May) is reported, depending on whether the level is set to beginning or ending value.
Inventory is one example of a nonaggregatable metric. The following metric definition reports the inventory on hand at the end of the month. The level is set at the report level and at month, with a grouping of ending fact, so that the last entry in the fact table is used.
Sum([End on hand]) {~, Month}
If level (dimensionality) options are shown (click the Show level (dimensionality) properties icon on the toolbar), the metric definition looks like Sum([End on hand]) {~+, >|Month+}. If grouping was set to beginning fact, the indicator would be <|. Similarly, the indicators for beginning lookup and ending lookup are < and >, respectively. See Metric Level Symbols: Defining Expression Syntax.
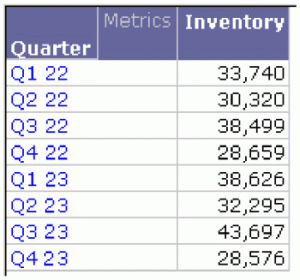
A report contains this metric and the month attribute. The last entry for each month in the fact table is placed on the report. No calculation is performed.
This is a sample of different portions of the report, not the entire report.
When the same metric is used on a report with quarter, the value for each quarter is the value for the last month in the quarter. The monthly values for each quarter are not added together. For example, the on-hand inventory for March 2022 is 33,740. Since that is the last month in Q1, that value is reported on the quarterly report.
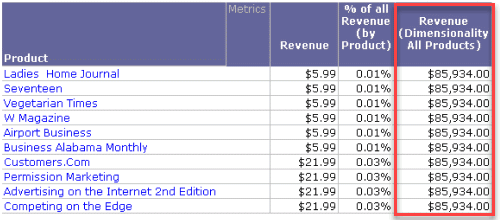
Grouping in the Products - By Top 10% Customers Report
Review the Products - By Top 10% Customers report described at the beginning of Level Metrics: Modifying the Context of Data Calculations. In the report, the % of All Revenue (by Product) metric divides the Revenue metric by a metric called Revenue (Dimensionality All Products). The Revenue metric is calculated at the report level, in this case, for each product. The level of the Revenue (Dimensionality All Products) metric has been set to product, with a grouping of none. This allows the calculation to total the revenue for all products, not just the single product on the particular row of the report. Therefore, the same number is calculated for each row of the report, producing the revenue percentage.
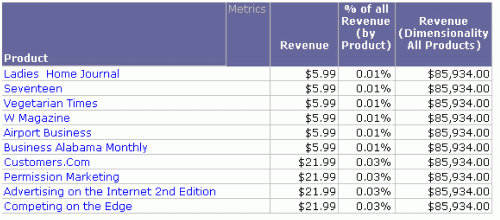
The grouping is indicated in the metric definition. If the grouping is standard, an additional indicator is not displayed. If the grouping is set to none, as in the Revenue (Dimensionality All Products) metric, an exclamation mark is placed before the target name, as shown below:
Revenue {~+, !Product+}
If you open this metric and do not see the exclamation mark, select Show level (dimensionality) properties from the View menu.
Filtering: Interaction with Report Filters
Filtering in the Products - By Top 10% Customers Report
Review the Products - By Top 10% Customers report described at the beginning of Level Metrics: Modifying the Context of Data Calculations. In the report, the % of All Revenue (by Product) metric divides the Revenue metric by a metric called Revenue (Dimensionality All Products). The Revenue metric is calculated at the report level, in this case, for each product. The level of the Revenue (Dimensionality All Products) metric has been set to product, with filtering set to standard. The report filter contains a prompt for quarter and a filter for the top ten percent of customers based on revenue. Standard filtering means that revenue is calculated for only the quarter selected in the prompt.
The filtering is indicated in the metric definition. Standard filtering is indicated by a plus sign after the target, as shown in the definition of the Revenue (Dimensionality All Products) metric shown below:
Revenue {~+, !Product+}
If you open this metric and do not see the plus sign, select Show level (dimensionality) properties from the View menu.
All of the metrics in these examples, except the first report, have grouping set to none.
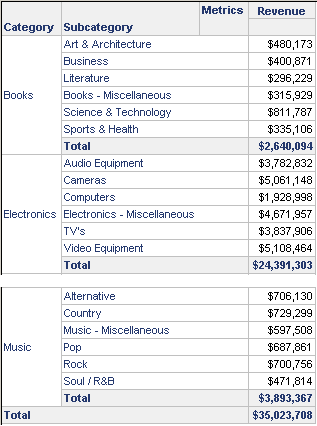
Consider the following report as a baseline to show the revenue for each Category and Subcategory.
None of the reports in these examples are presented in full; they are only subsets of the complete report.
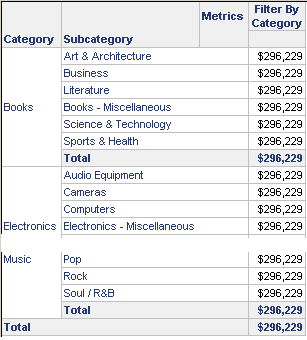
A revenue metric is defined with Category as the target, no grouping, and standard filtering. A report is created with Category, Subcategory, this new revenue metric, and a filter for the Literature subcategory. When the report is executed, the revenue is the same for every row, as shown below. All categories are included on the report, even though the report filter is Literature. This is an effect of setting the grouping to none. Since Category in the target is a parent of Subcategory in the filter, all subcategories are included on the report. The metric value is the grand total of the filter, in this case, only Literature.
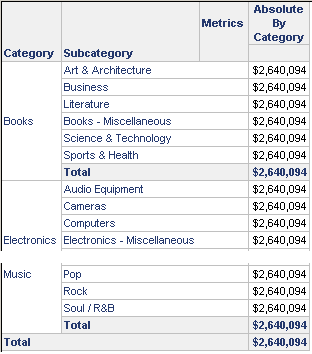
The same report is created with a metric set to absolute filtering and no grouping. When the report is executed, the revenue is the same for every row, as shown below. Because of the absolute setting, the report filter rolls up to the level of the metric, and thus Subcategory is elevated to Category. Because the report is filtered for the Literature subcategory, the value is revenue for the Books category.
If level (dimensionality) options are shown, the metric definition looks like Sum(Revenue) {~+, !Quarter*}. The asterisk denotes absolute filtering, the exclamation mark that grouping is set to none. See Metric Level Symbols: Defining Expression Syntax.
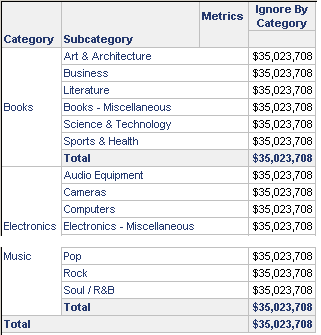
The same report is run, but this time with a metric that has level filtering set to ignore. Grouping remains set to none. Again the metric value is the same for the whole report, but now it is the grand total of all sales in the project. Since Category is related to Subcategory, the filter is also ignored.
If level (dimensionality) options are shown, the metric definition looks like Sum(Revenue) {~+, !Quarter%}. The percent sign denotes ignore filtering.