Strategy One
How to Display the Query View for a Visualization
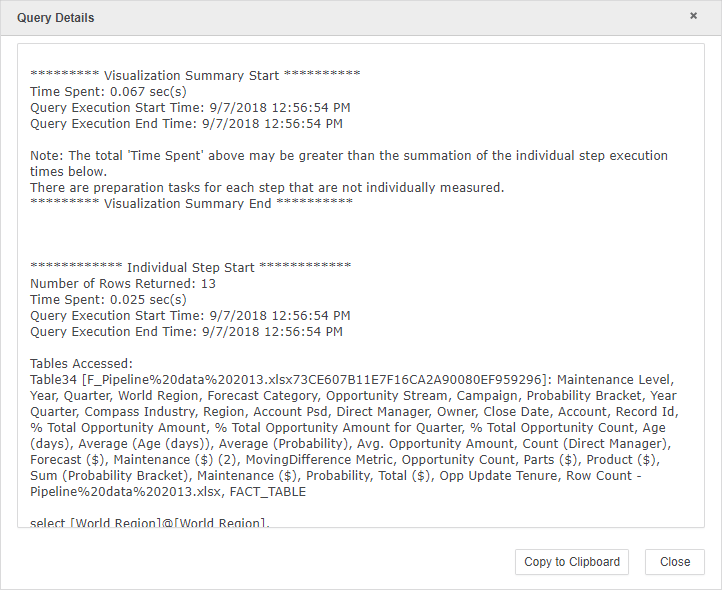
A query view displays the SQL or CSI queries executed against a visualization's data source. Use the query view to troubleshoot data discrepancies or fine-tune the underlying queries to increase performance.
Open the Query View
-
Click More
 at the top right of a visualization.
 -
Choose Query Details.
The query run against the data source appears on the Query Details dialog.
- Click Copy to Clipboard.
- Paste the query into a text editor or IDE to identify issues, while referring to the visualization for reference.
Query does not capture the following:
- Smart calculation steps, such as metric limits from metric selectors, smart metric calculations, calculation elements, and subtotals.
- Details about dataset execution.
- Data blending instructions for new derived elements, derived attributes, and similar calculations that are part of document setup.