Strategy One
Create a Line Chart
- Open a dashboard.
-
In the top toolbar, click .
- Choose Line and one of the many line chart options.
- In the Datasets panel, double-click attributes and metrics to add them to the visualization. A line chart requires at least one attribute and one metric. Time attributes are recommended for line charts and dual axis line charts.
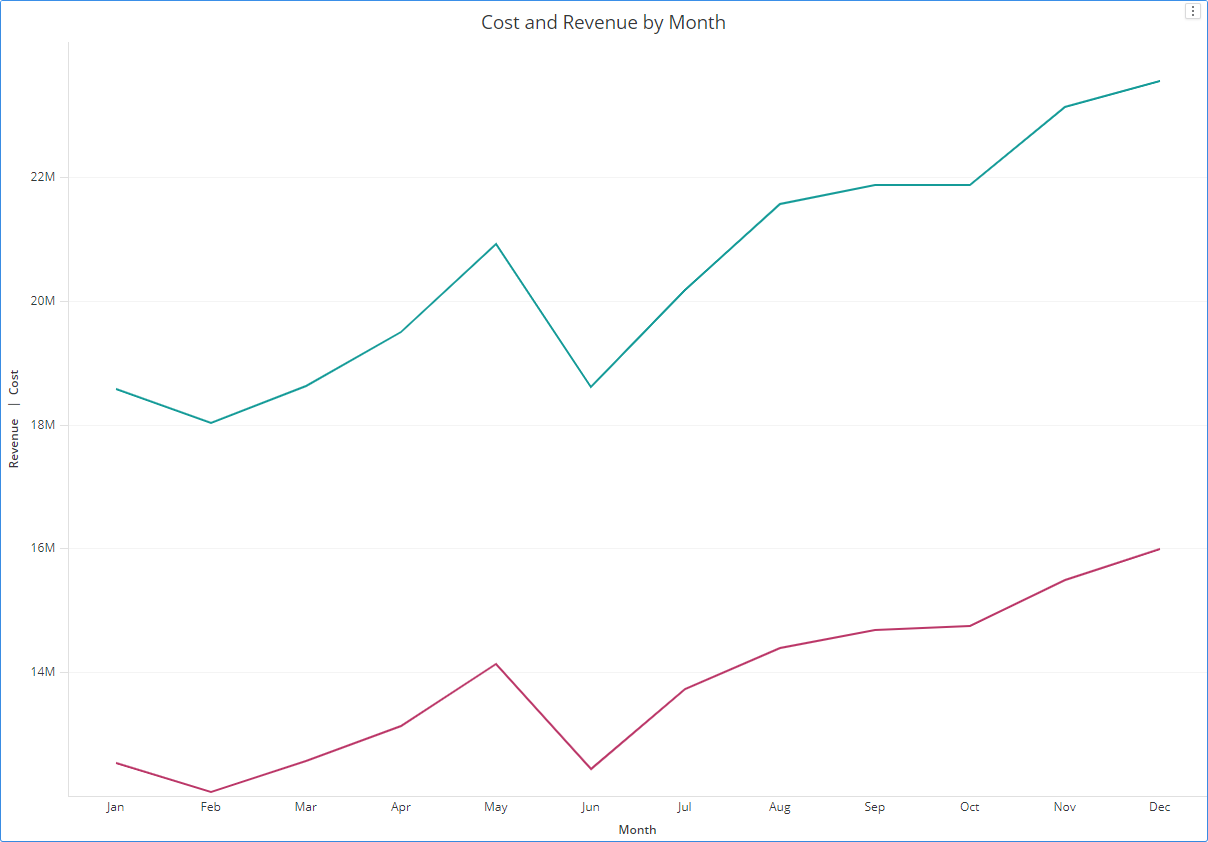
Example Line Chart
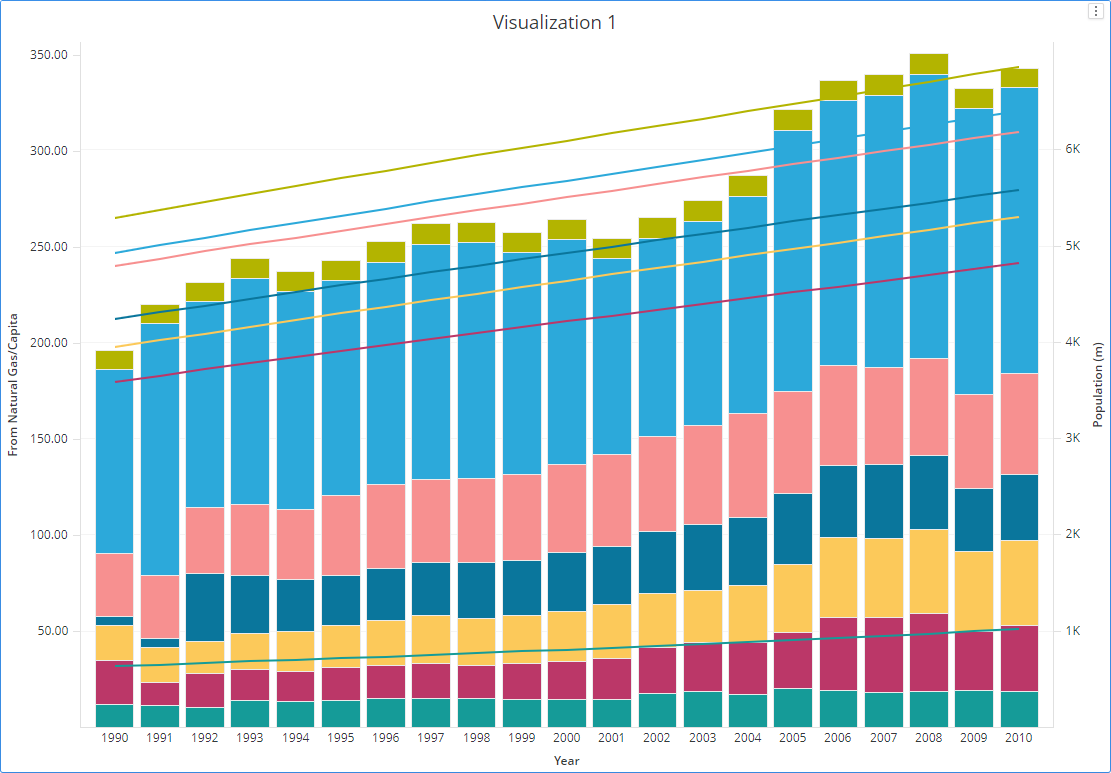
Example Combo Chart