Strategy One
Create a Dual-Axis Graph
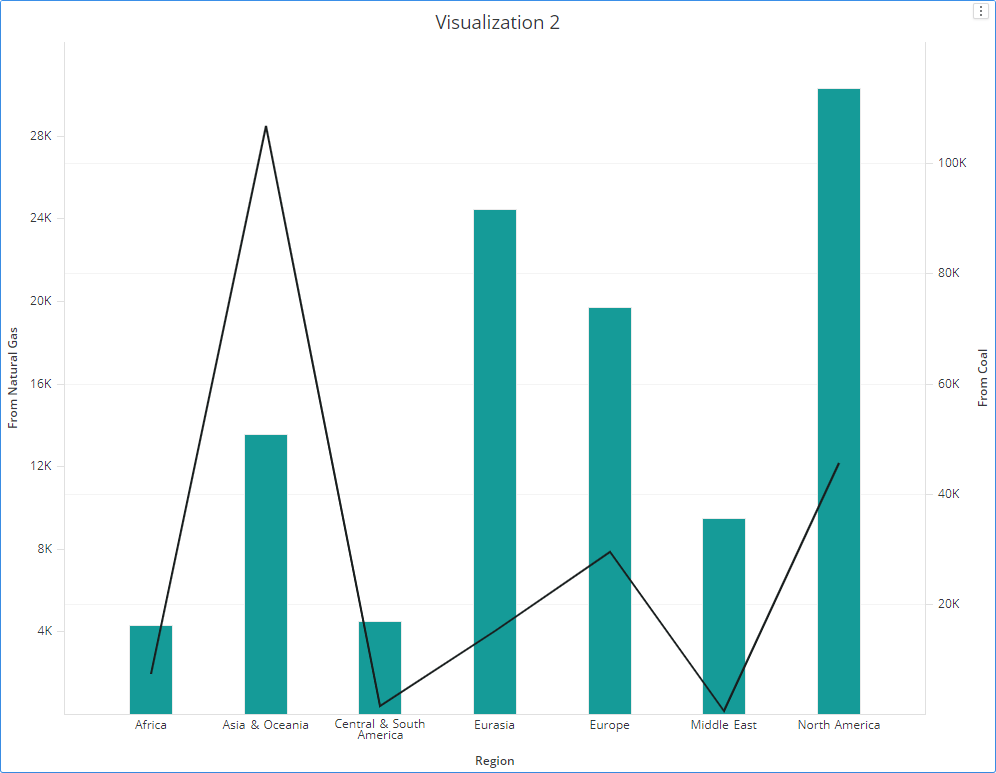
A dual-axis graph is useful for displaying metrics that contain very different ranges of values. A dual-axis graph displays two different axes, on opposite sides of the graph.
To Create a Dual-Axis Graph
- Open an existing dashboard that contains a bar or line graph that you want to convert to a dual-axis graph.
-
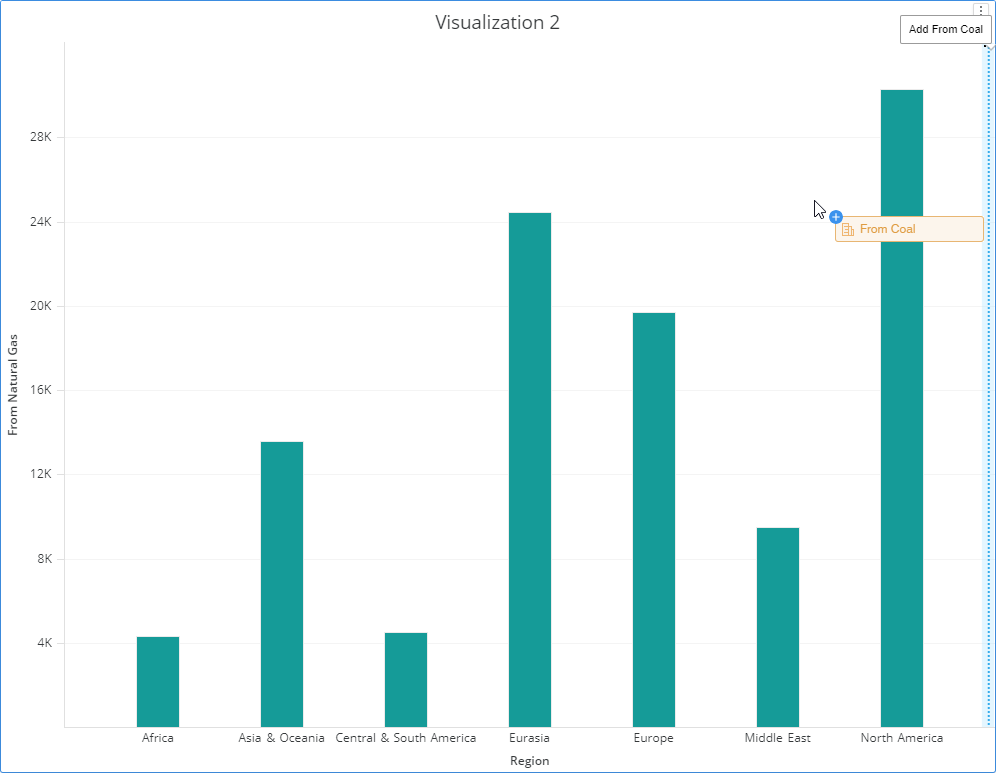
Drag a metric onto the empty axis, that is parallel to the existing metric axis.
Example Dual-Axis Graph