Strategy One
Define Reusable Dashboard Themes
Starting in MicroStrategy ONE Update 10, Application Architects can
Library and Workstation users can apply a theme by a simply clicking to change the look and feel of their dashboards. This is much easier and efficient than changing the formatting in each visualization.
Check out the topics linked below to get started:
Create a Reusable Dashboard Theme
-
Open the Workstation window and run the dashboard you want to save a theme from.
-
Choose Format > Save as Theme. You must have Use Formatting Editor privilege.
-
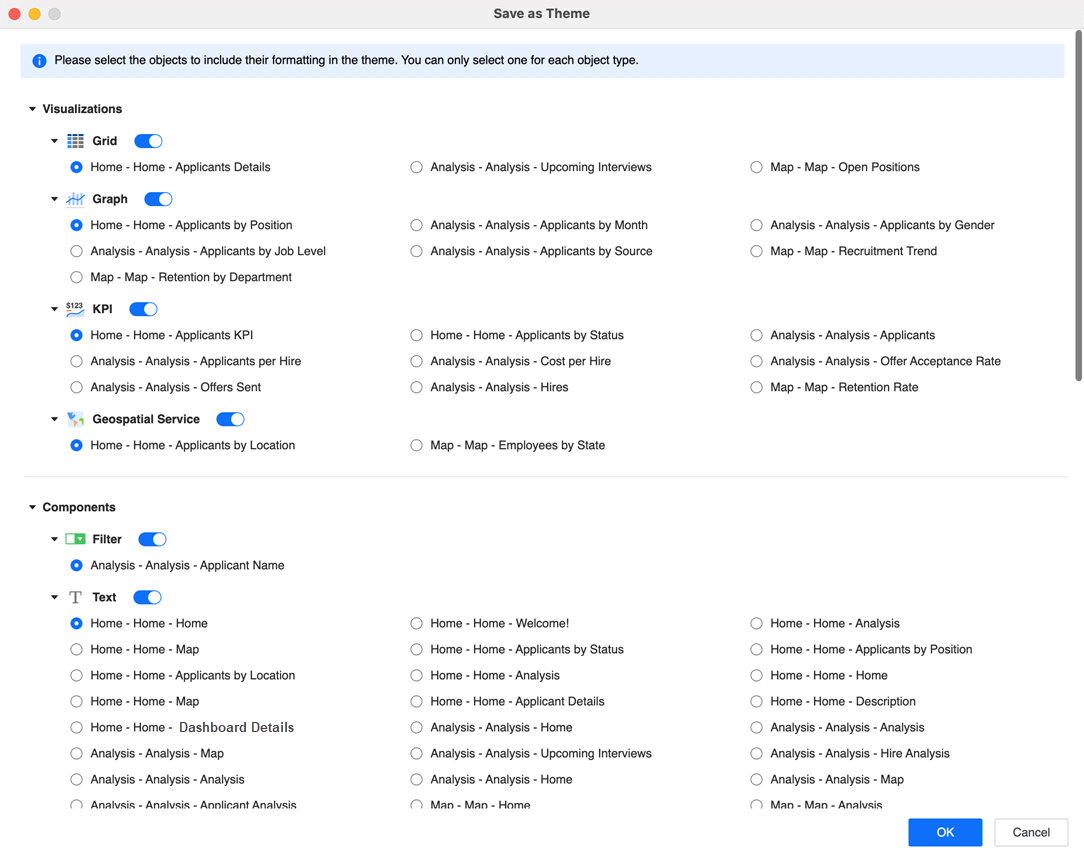
Select objects to include their formatting in the theme. You can only select one for each object type.
-
Click OK and save your theme with a meaningful name.
Apply a Theme to Your Dashboard
-
Open a dashboard.
-
Edit a dashboard.
-
Choose Format > Select Theme.
-
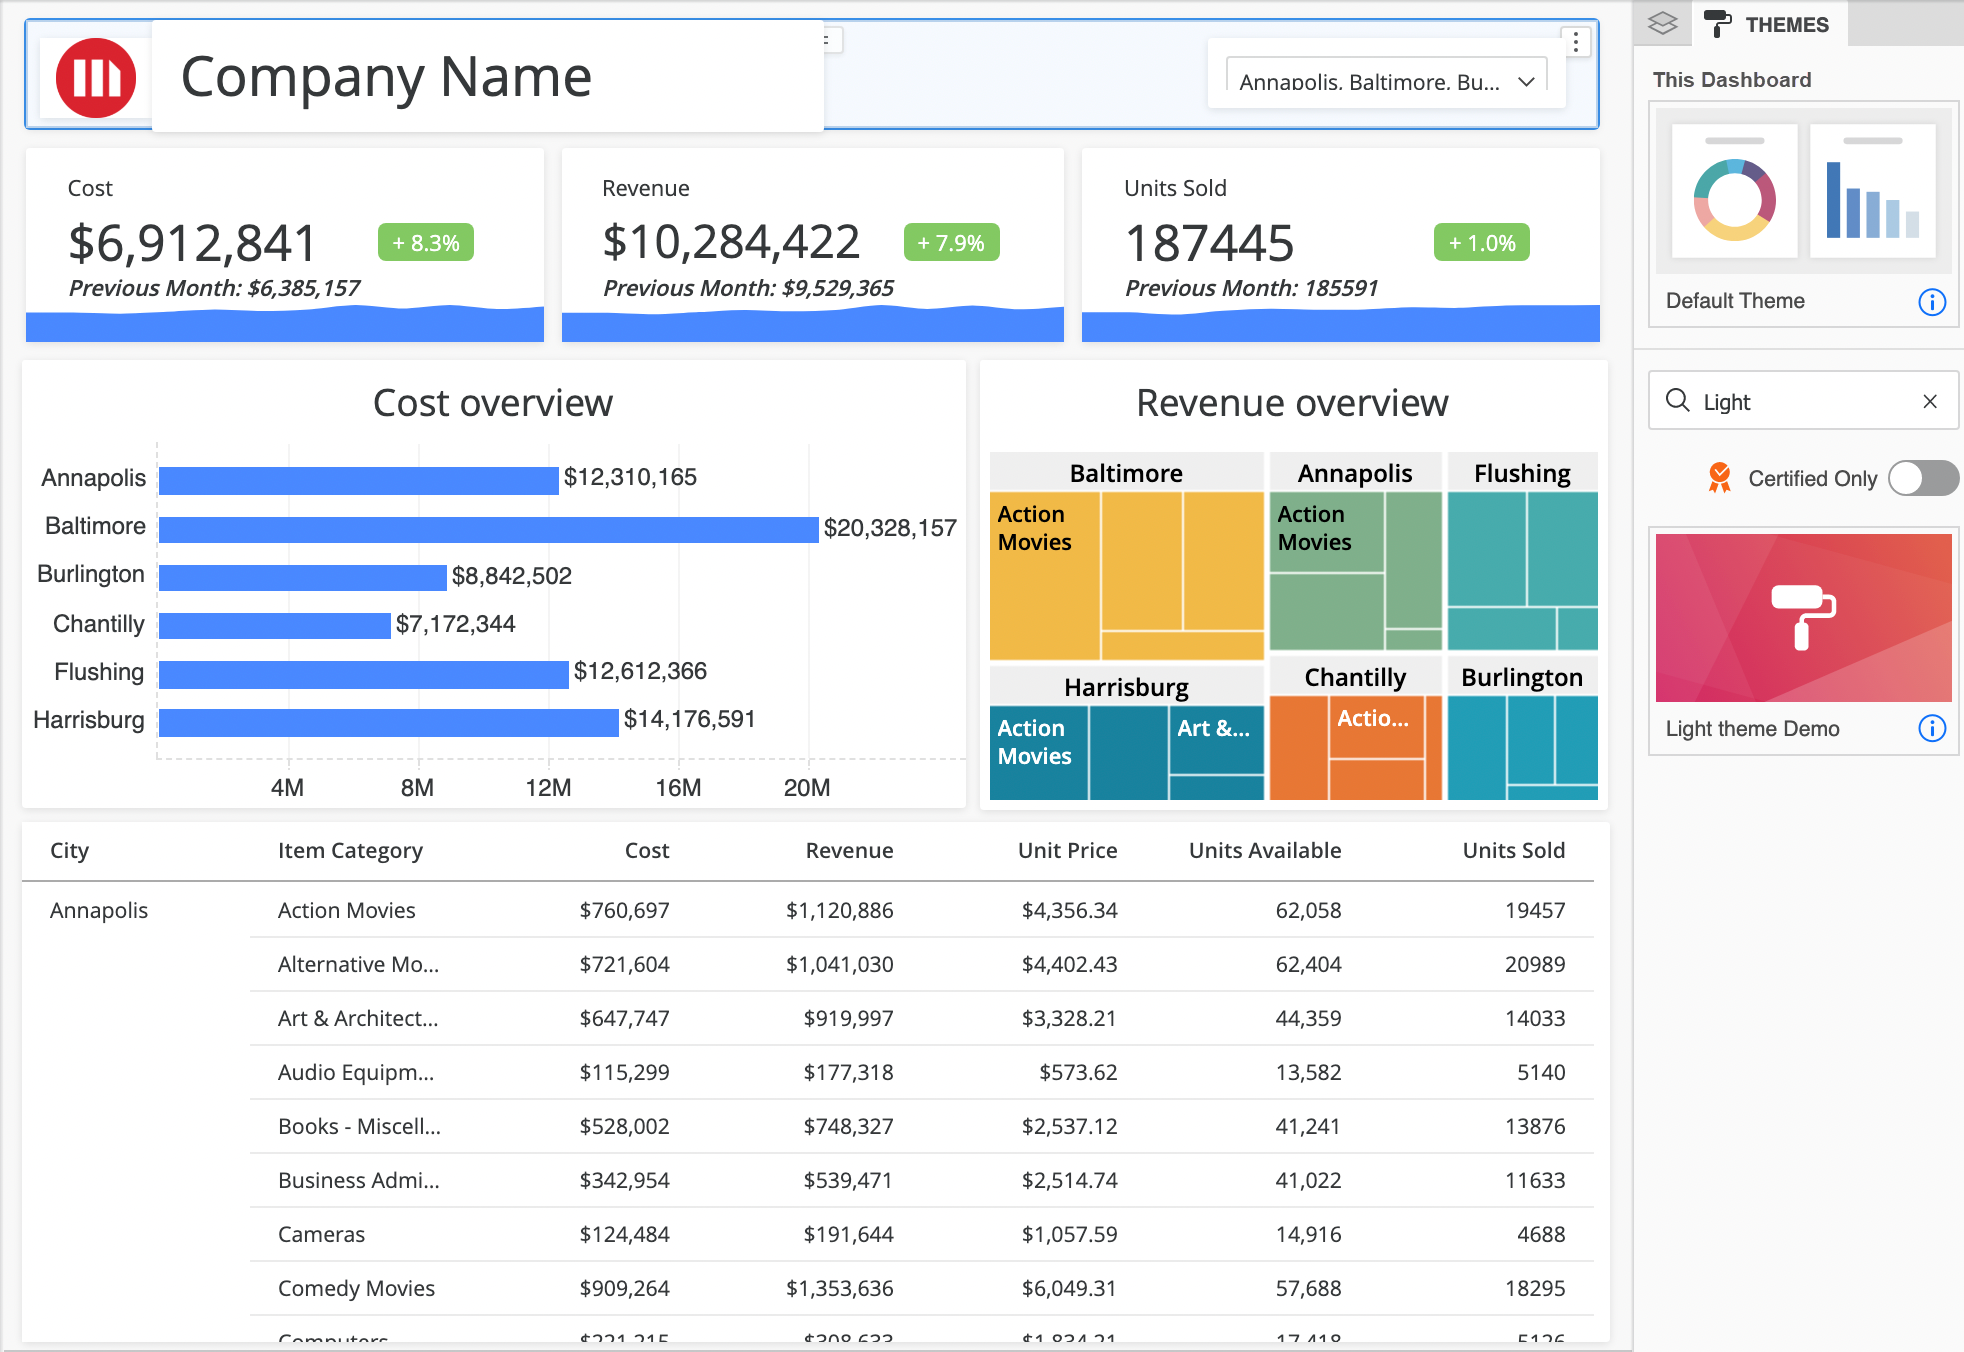
In the Themes panel, search for your theme.
-
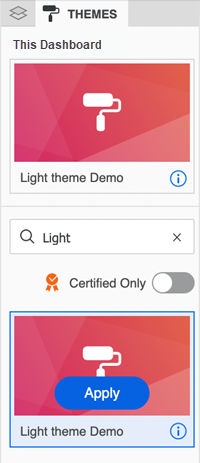
Hover over your theme and click Apply.
Change the Theme Cover Image
-
Open the Workstation window, click Dashboard, and locate your theme.
-
Right-click the theme and choose Properties.
-
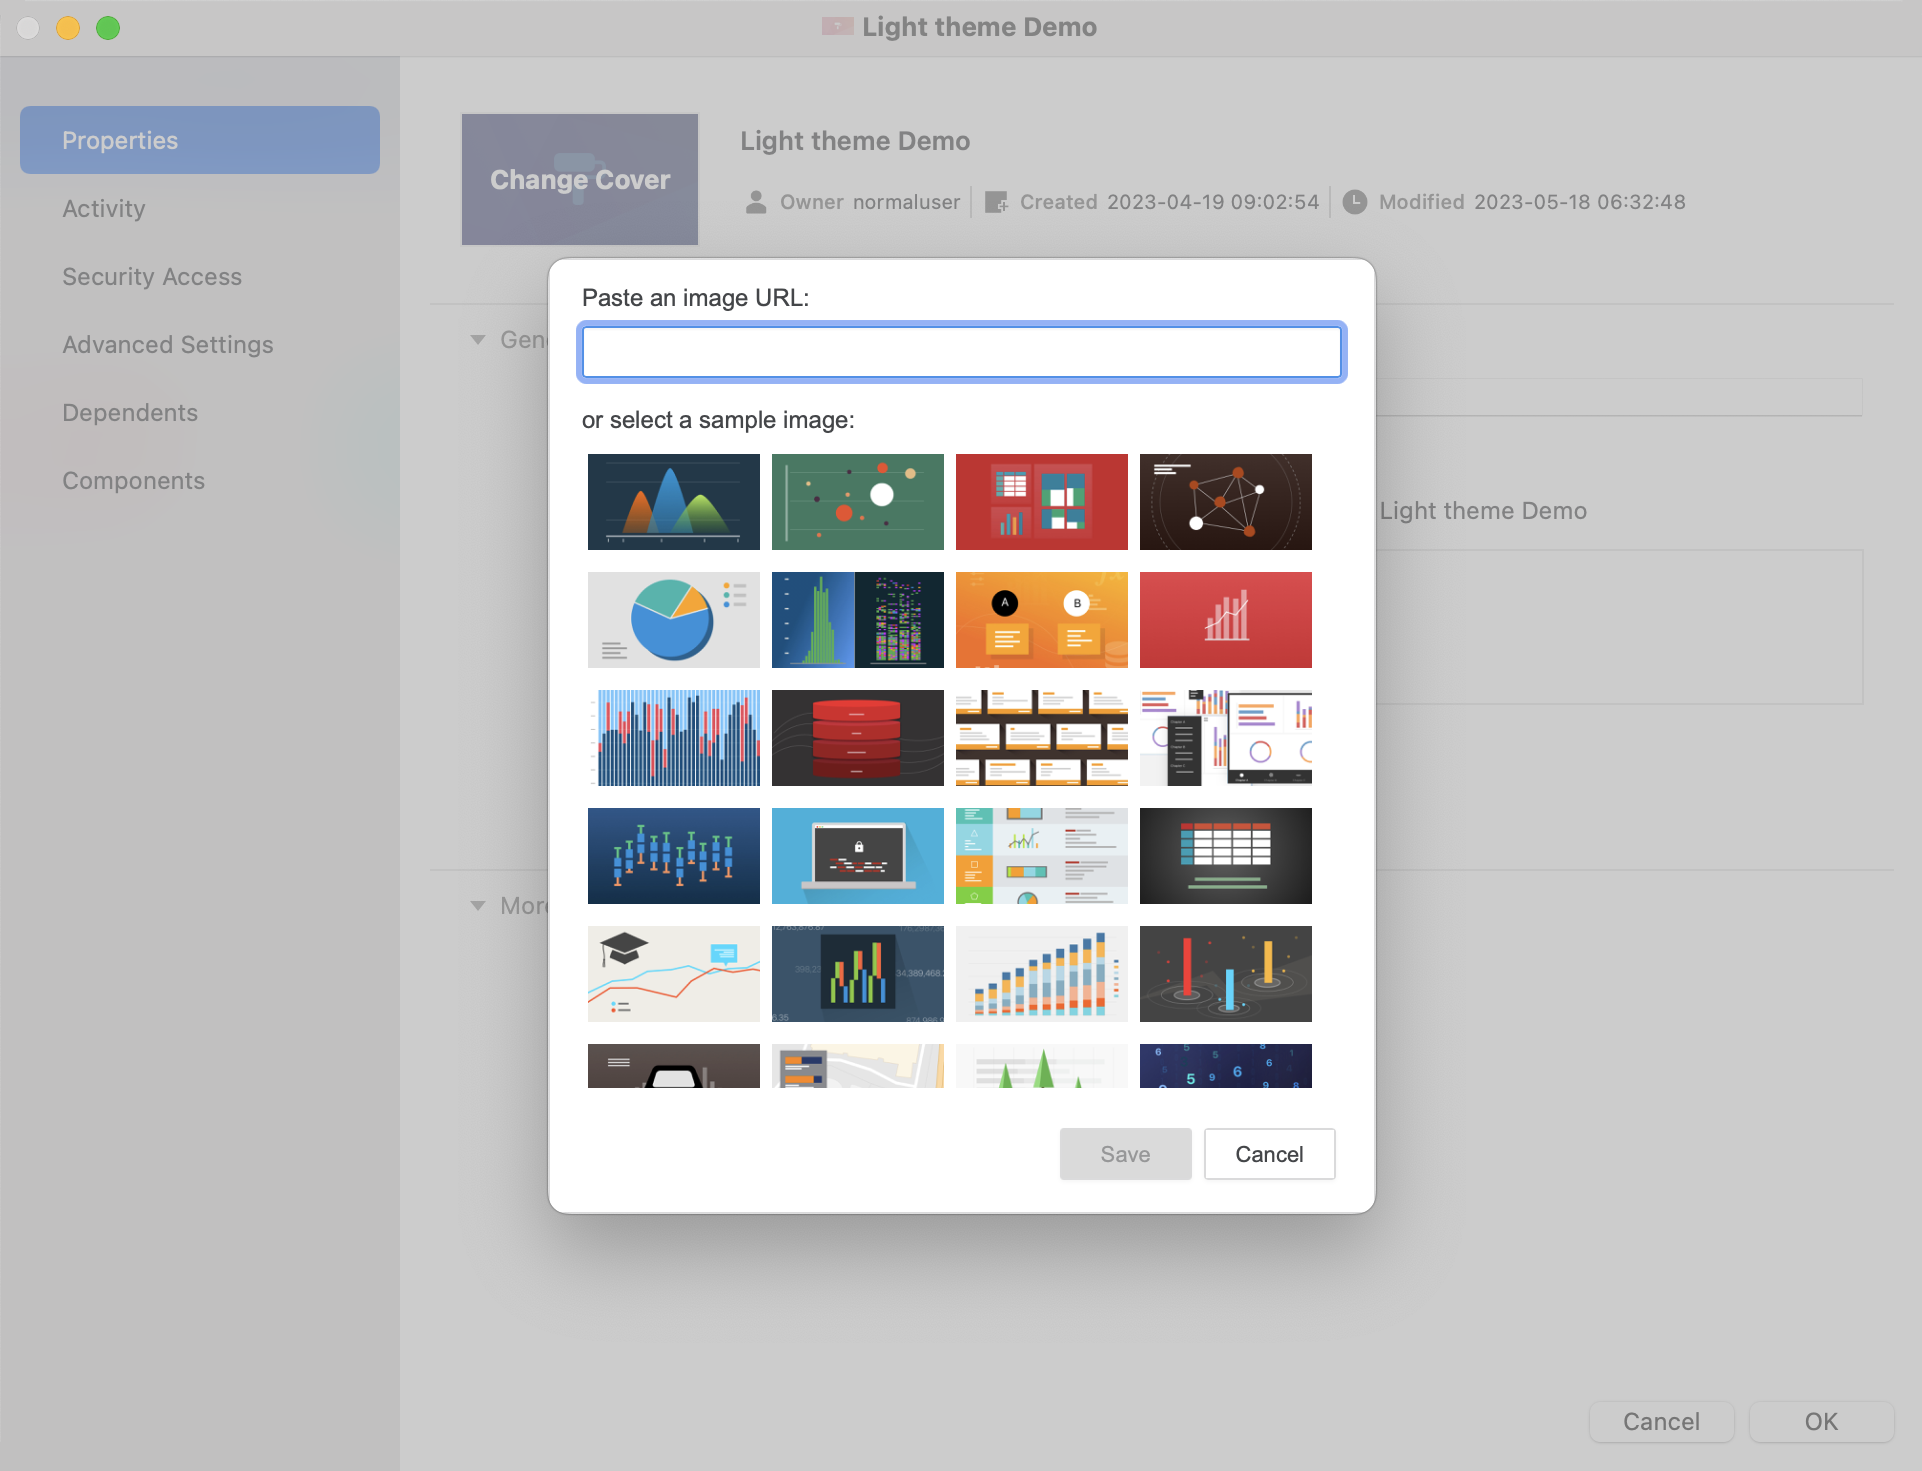
Click Change Cover and paste an image URL or select a sample image.
-
You can see the custom cover image for your them in the Themes panel.

Supported Visualizations, Components, and Format Properties
This section describes the supported visualizations, components, and format properties for themes.
Supported Visualizations
-
Grid
-
Graph
-
Bar
-
Line
-
Area
-
Combo
-
Bubble
-
Pie
-
-
KPI
-
Multi-Metric KPI
-
Comparison KPI
-
Gauge
-
Geospatial Service
-
Map
-
Heatmap
-
Waterfall
-
Box Plot
-
Network
-
Histogram
-
Sankey
-
Time Series
Supported Components
-
Filter
-
Text
-
Image
-
HTML Container
-
Shape
-
Panel Stack
Supported Format Properties
All supported format properties can be saved in the theme.
The following properties from the dashboard level are supported:
-
Dashboard color palette
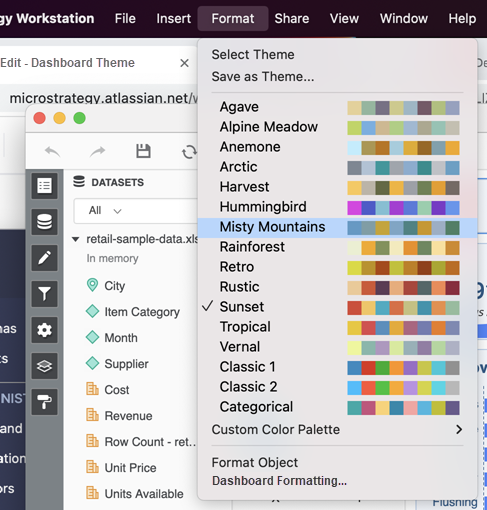
-
Dashboard layout and background color in Format > Dashboard Formatting.
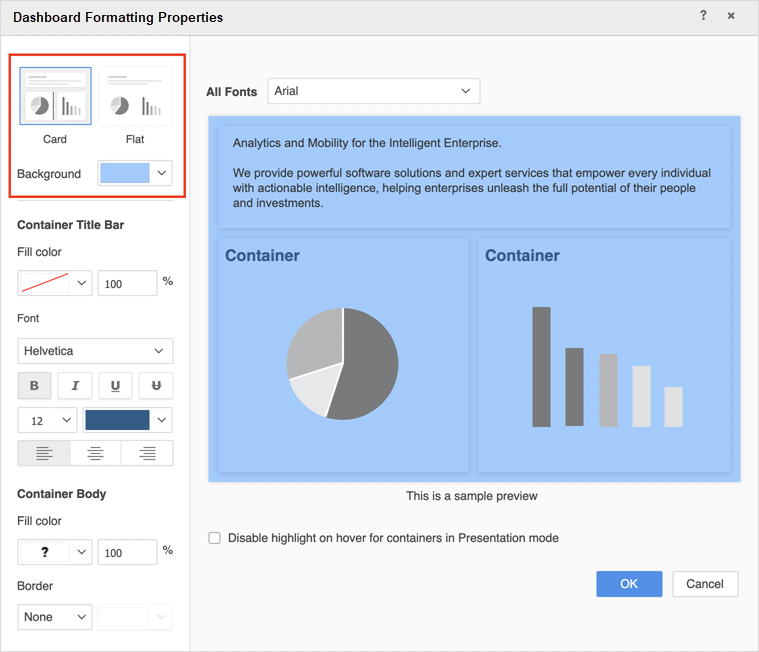
-
You can also set the background for a single page instead of the entire dashboard.
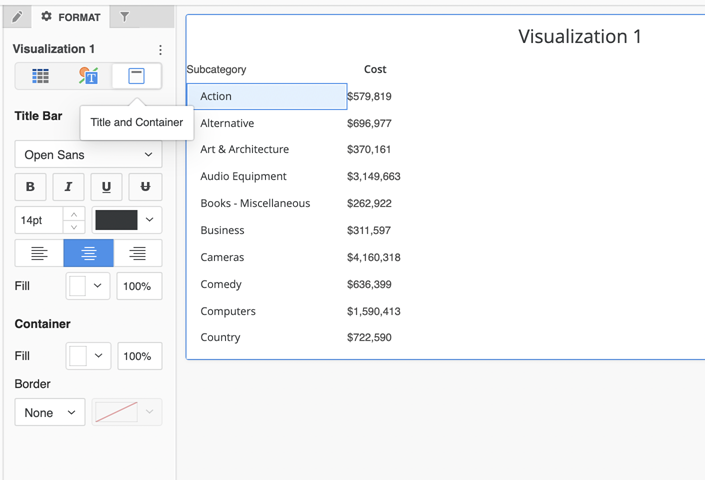
All properties in Title and Container on the Format panel for visualizations and components are supported, except the on/off status of the title bar.
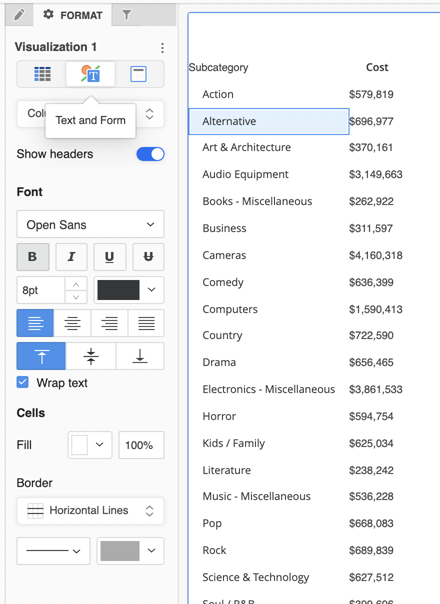
The majority of the properties in Text and Form on the Format panel for visualizations and components are supported. Some properties that are strongly data dependent are not supported, such as Reference Line, Trend line, and Color By in graphs. Some properties that determine an on/off status and are not format related are not supported, such as the on/off toggle for Data Labels.
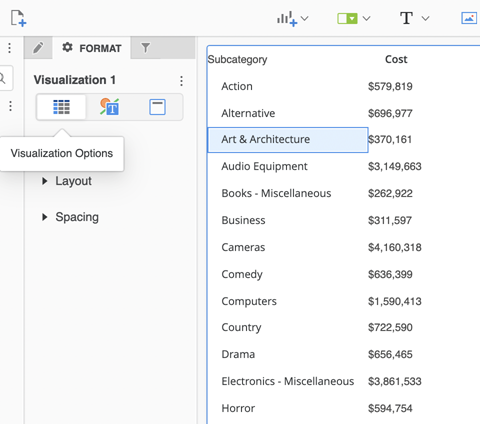
Properties in Visualization Options on the Format panel are not supported.
Related Topics
