Strategy ONE
Introduction to the Visualization SDK
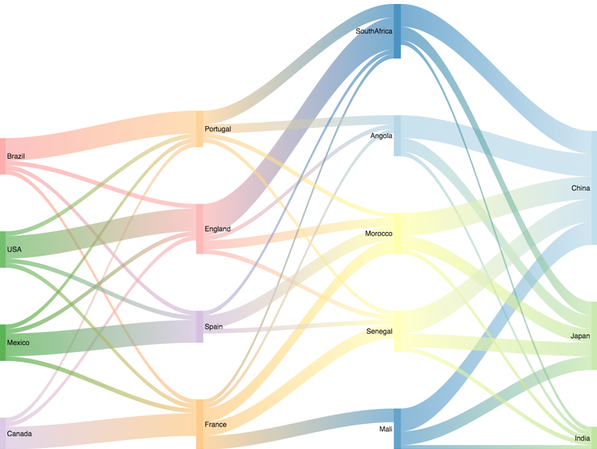
Visualizations can express data in much more meaningful ways than is possible with traditional graph types and are a very popular way for enterprises to present and analyze their data. The MicroStrategy Visualization SDK provides APIs, sample code, documentation, and the Custom Visualization Tool. This tool is designed to help users quickly and easily create the file and folder structure of a visualization plug-in that is integrated with MicroStrategy.
The Custom Visualization Tool is replacing Visualization Builder in the MicroStrategy 2021 release. Take a look at some of its exciting new features and try it out! Visualization Builder can still be used in the 2019 and 2020 releases, but is no longer supported in version 2021 and up.

The Visualization SDK makes it easy for developers to build custom visualizations using popular third-party libraries like D3 and Google. MicroStrategy provides robust support for both server-side and client-side components. On the server side, MicroStrategy takes care of providing the data used by the visualization and making custom visualizations available for use in dashboards and documents; all the developer needs to do is register the visualization in an XML configuration file. On the client side, MicroStrategy provides its own JavaScript framework, which includes all the functionality needed to interact with MicroStrategy objects.
The following sections are designed to help you build an visualization that integrates with MicroStrategy. You are expected to have a basic knowledge of JavaScript.
-
Create a visualization plugin
Describes how to create a visualization plugin, learn from sample code, use the APIs, and understand the configuration files that are part of each visualization plug-in.
-
Customize a Visualization
Describes how to customize an HTML5 visualization, by making settings on the Properties panel on a dashboard or by modifying the configuration and properties files in the plug-in. Also describes how to enable and customize the out-of-the-box Image Layout visualization..
-
Provides instructions for deploying a custom visualization so that it can be used In MicroStrategy Web or MicroStrategy Desktop, on either a Mac or a Windows machine.
-
Describes and provides a link to the Custom Visualization Gallery, which has a variety of sample visualizations that showcase how to use the APIs available with the HTML5 Visualization SDK. From the Gallery, you can download a plug-in that lets you use the visualization in MicroStrategy Web or Desktop, or you can download an .mstr file that can be imported into MicroStrategy Desktop to give you a working version of the sample, complete with data.
![]() To see changes to the Visualization SDK in the current release, refer to What's New.
To see changes to the Visualization SDK in the current release, refer to What's New.
To maintain your current customizations and take advantage of new features, refer to Upgrading to a newer version of MicroStrategy.
For earlier versions of the Visualization SDK, refer to Previous Releases.
