MicroStrategy ONE
Level metrics: A practical overview
This topic is designed to help you choose the right combination of level target, filtering, and grouping (referred to as elements) to achieve your desired results. This is only a brief overview, designed as a quick introduction for new users or a quick review for experienced metric creators. It shows the effects of different element settings on a single metric when used in the same report. The effects are summarized in the Level metrics summary table below.
The elements of a metric level are described briefly below, with references to more detailed information following this section.
-
Target: The target is the attribute level at which the metric calculation groups. For a more detailed description, see The context of a calculation: Level metric target.
-
Grouping: Grouping determines how the metric aggregates. For a more detailed description, see Defining how aggregation is performed: Level metric grouping.
-
Filtering: Filtering governs how the report filter interacts with the metric calculation. For a more detailed description, see Interaction with report filters: Level metric filtering.
The base metric and report
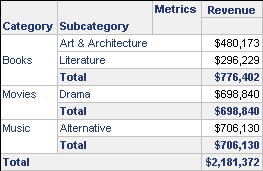
All the metrics in this topic are based on a revenue metric that is the sum of the Revenue fact. The base report displayed below contains this Revenue metric, and the Category and Subcategory attributes. Each category is subtotaled, and a grand total is calculated. It has a report filter on the following subcategories:
-
Art & Architecture
-
Literature
-
Drama
-
Alternative
The base report is shown below:

Level metrics summary table
The Revenue metric calculates the revenue for each subcategory displayed on the report.
|
To Calculate |
Set Filtering To |
Set Grouping To |
|---|---|---|
|
Revenue at the category level, including only the subcategories displayed on the report |
Standard |
Standard |
|
Revenue at the category level, for all subcategories in the categories displayed on the report |
Absolute |
Standard |
|
Total revenue for the subcategories displayed on the report |
Standard |
None |
|
Total revenue for all subcategories in the categories displayed on the report |
Absolute |
None |
|
Total revenue for all subcategories in the project |
Ignore |
None |
All the level metrics described in this section have a target of Category.
Category revenue examples
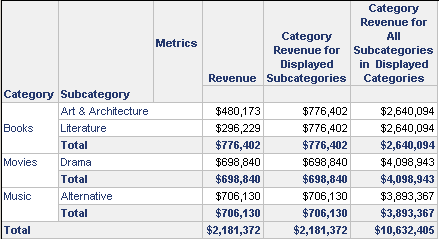
The following report shows the base report with the addition of two new metrics, both measuring category revenue in different ways.

Notice that the Category Revenue for Displayed Subcategories metric returns the same number as the category subtotal. That is, the Art & Architecture and Literature columns are the same as the Books Total. Why?
-
Standard filtering allows the report filter to interact as usual in the metric calculation. Therefore, only the subcategories in the report filter are included in the metric calculation. This is affirmed by the grand total of this metric—it matches the total for the Revenue metric. This indicates that only the attributes displayed on the report are included in this Category Revenue metric.
The numbers returned by the Category Revenue for All Subcategories in Displayed Categories metric are higher than the numbers for the other metrics on the report. Why?
-
Absolute filtering changes the filter on children of the target, by raising it to the level of the target, if possible. In this example, the report filter is Subcategory, which is a child of Category, the level target. Since the report filter is on a lower level than the target, the filter is raised to the level of the target. All subcategories in the categories on the report are included in the metric calculation.
Why do the Category Revenue metrics calculate the same number for each row in a particular category?
-
Both metrics have standard grouping, which means that the metric groups by the attribute level of the target. In this case, the target is category. The metric calculation is rolled up to Category, so the same number is repeated for each row in a particular category.
Total revenue examples
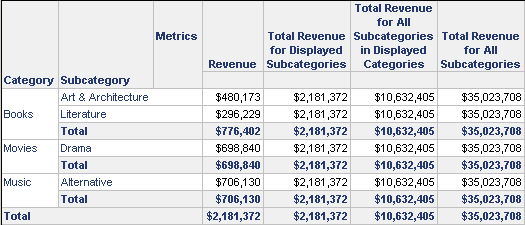
The following report shows the base report with the addition of three new metrics, all measuring total revenue.

The most obvious difference between this report and the Category Revenue example above is that each column contains only one number; each metric is returning only one result, regardless of row. Why?
-
All the metrics on this report, except for Revenue, have grouping set to none. No grouping means that the metric does not group on the target of category or the target's child attributes, such as subcategory. Therefore, separate results are not calculated for the different attributes on the report; only one result is calculated.
The Total Revenue for Displayed Subcategories metric returns the same number as the total for the Revenue metric. Why?
-
Standard filtering allows the report filter to affect the metric. Therefore, only the subcategories in the report filter are included in the metric calculation. This is confirmed by the number matching the total for the Revenue metric. This indicates that only the attributes displayed on the report are included in this Total Revenue metric.
Refer to the report in the Category Revenue examples above. Notice that the total for the Category Revenue for All Subcategories in Displayed Categories metric is the same amount calculated for the Total Revenue for All Subcategories in Displayed Categories metric on the Total Revenue report. Why?
-
Both metrics have filtering set to absolute. Absolute filtering raises the report filter to the level of the target, so all subcategories in the categories included on the report are added together.
The result for the Total Revenue for All Subcategories metric is huge. Why?
-
It includes the total revenue for all subcategories in the entire project. Ignore filtering disregards filtering criteria based on the attribute in the target and its related attributes (both parents and children). In this case, subcategory in the report filter is ignored, so the report filter does not apply to this metric.
