Strategy ONE
Time Series Forecasting Analysis
Time series forecasting is a powerful technique that empowers businesses to predict future trends and outcomes based on historical data patterns. At its core, it involves analyzing data points collected over successive intervals of time to identify underlying patterns, trends, and fluctuations. This predictive approach is particularly valuable in anticipating future changes and making informed decisions. By harnessing the power of advanced machine learning algorithms, Strategy's time series forecasting provides users with a seamless and intuitive means to uncover insights hidden within their data. Whether you're a business analyst, marketing manager, or finance executive, this capability offers a gateway to proactively strategize, allocate resources efficiently, and capitalize on opportunities. The integration of forecasting analysis saves valuable time and effort for users who previously relied on manual data processing and complex analytics methods to predict future outcomes.
Access Time Series Forecasting
Forecasting analysis is available in the following ways:
-
Through the visualization gallery in a dashboard, using a drag and drop interface to create a Forecast Line Chart visualization.
-
Auto can utilize natural language queries to perform forecasting analysis.
Create a Forecast Analysis Line Chart
-
Open a dashboard for editing.
-
In the top toolbar, click

-
Choose Insight+ > Forecast Line Chart
 .
. -
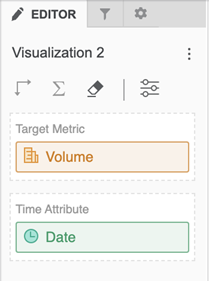
Drag a metric and time attribute from the Datasets panel to the Editor panel.
-
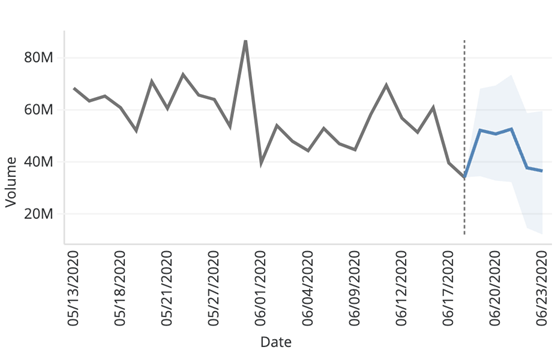
View the rendered visualization with the forecasted values on the right.
-
The default number of forecasted points is five. To change this number, go to Format panel and click Visualization Options
 . In Forecast length, change the number of forecasted points. The maximum number of forecasted points is 100.
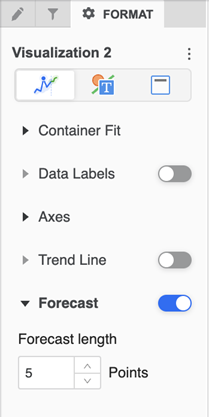
-
-
Use Auto Answers for Forecasting
To leverage the power of predictive insights within Auto Answers, enter your forecasting question using natural language. For example, "What's the projected sales for the next quarter?" Auto Answers provides you with accurate forecasts based on your query, its deep understanding of your dataset objects, and advanced machine learning algorithms. To include break by analysis, you can ask "What is the Forecast for Revenue over Data broken down by Category?".
Auto Answers' response consists of a clear natural language description of the forecasted data with an accompanying forecast line chart visualization, making it easy to understand what lies ahead. While the visualization may contain a limited number of data points when rendered in the confined space of the chat panel, expanding the prompt’s response displays the entire set of existing and forecasted data points.
Here's how you can delve into predictions using Auto Answers. The following examples are presented in expanded mode:
-
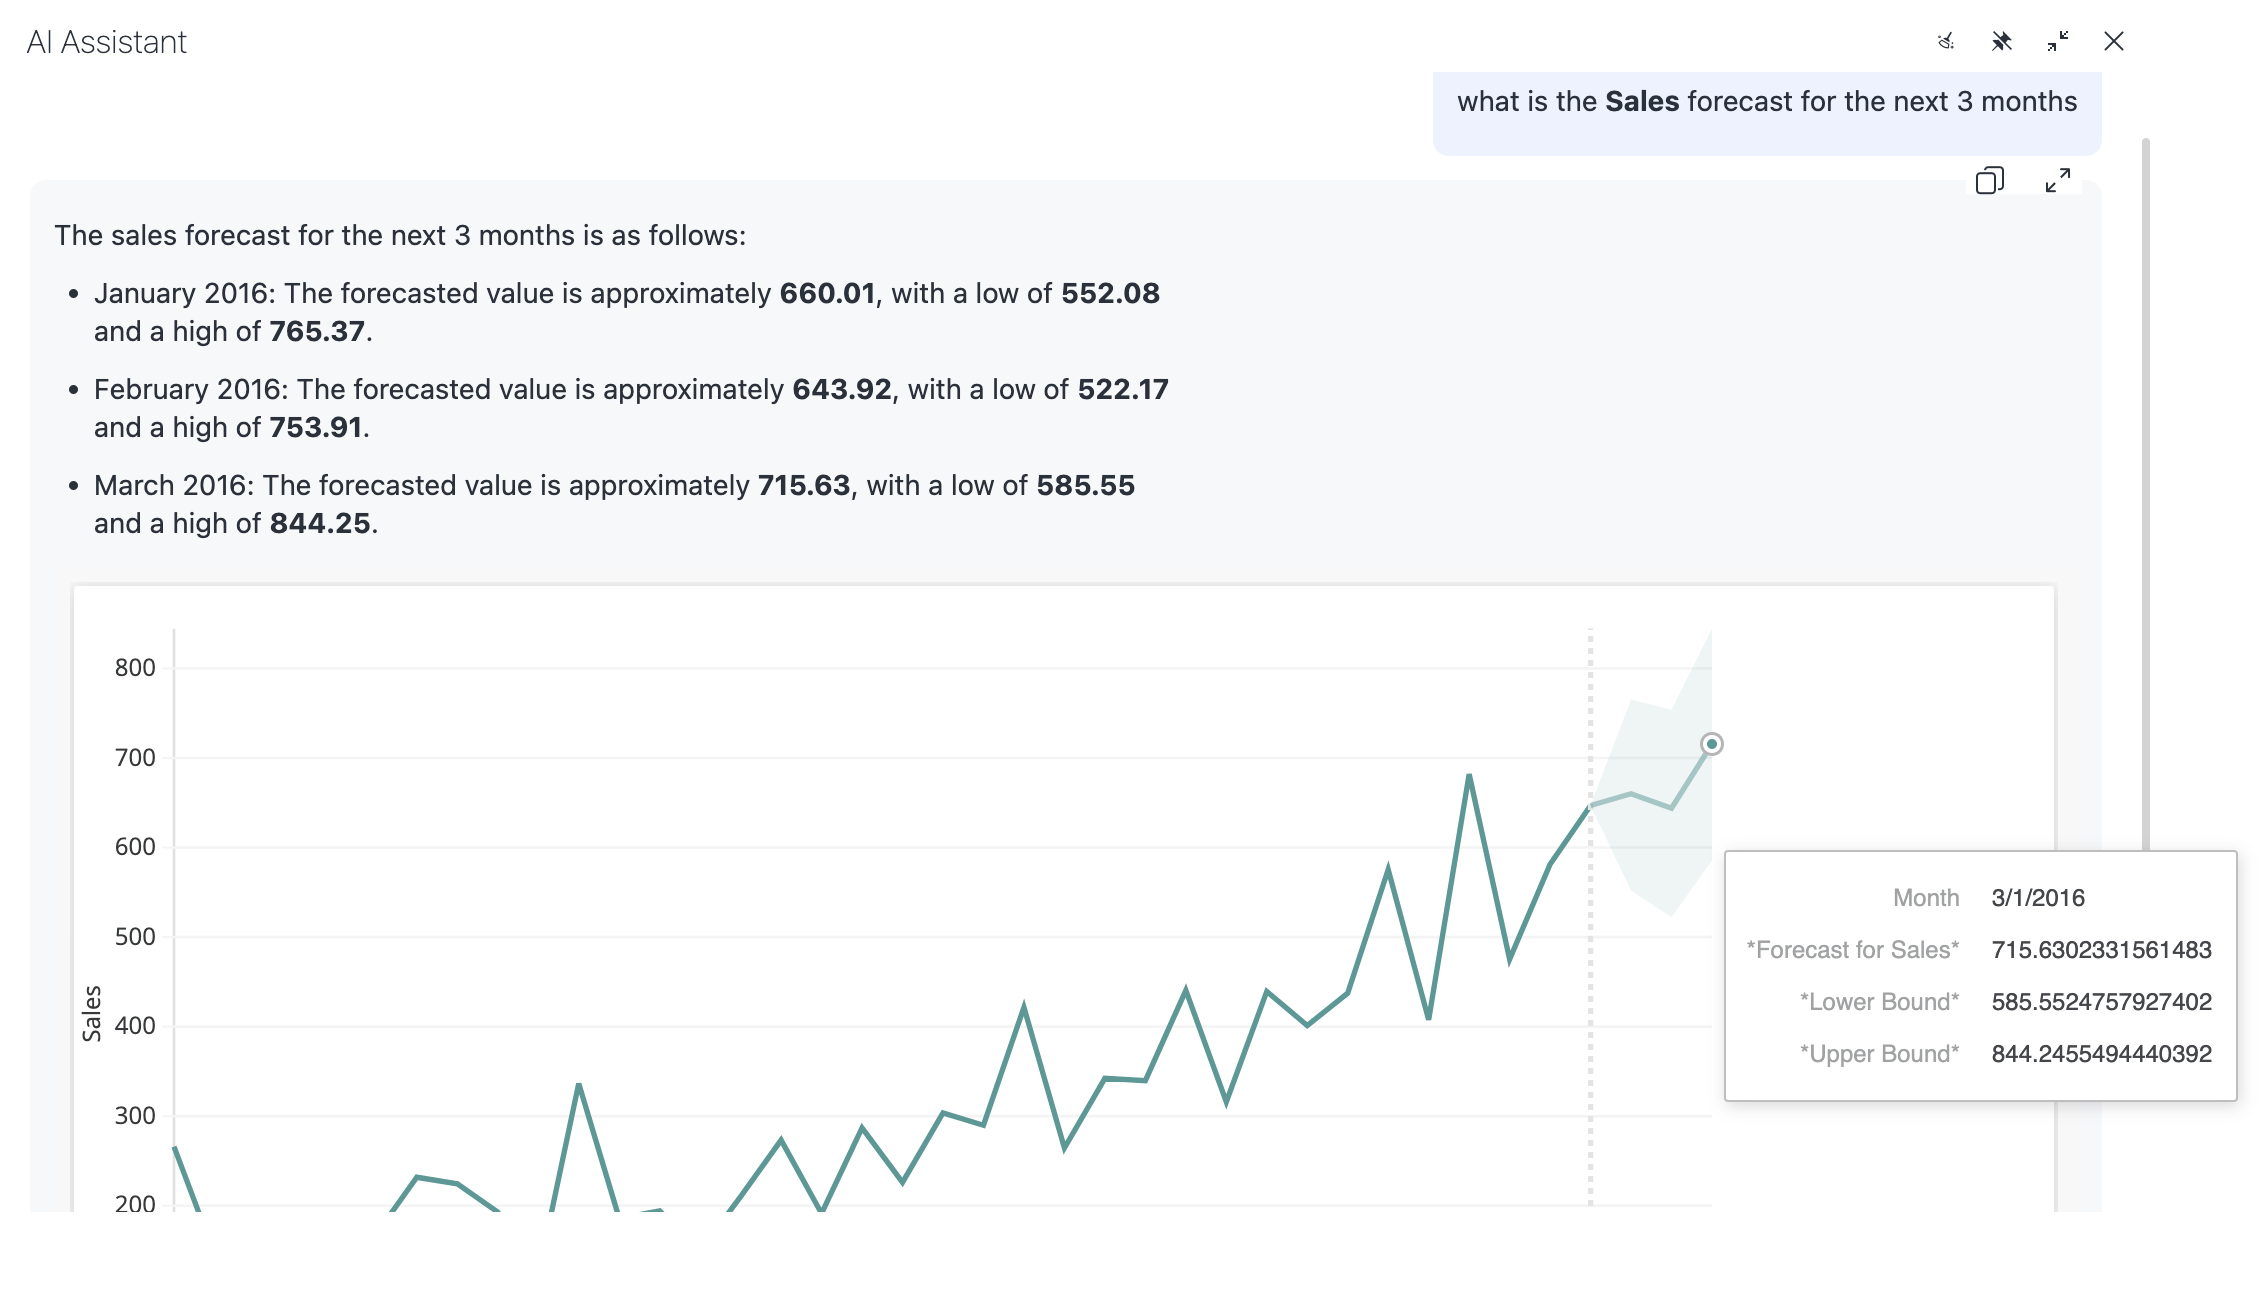
Next Few Months Prediction Start with a given monthly sales dataset. You can ask Auto Answers to forecast the sales for the next few months. The algorithm adeptly handles the task even if you're requesting predictions for an entire year based on monthly data.
-
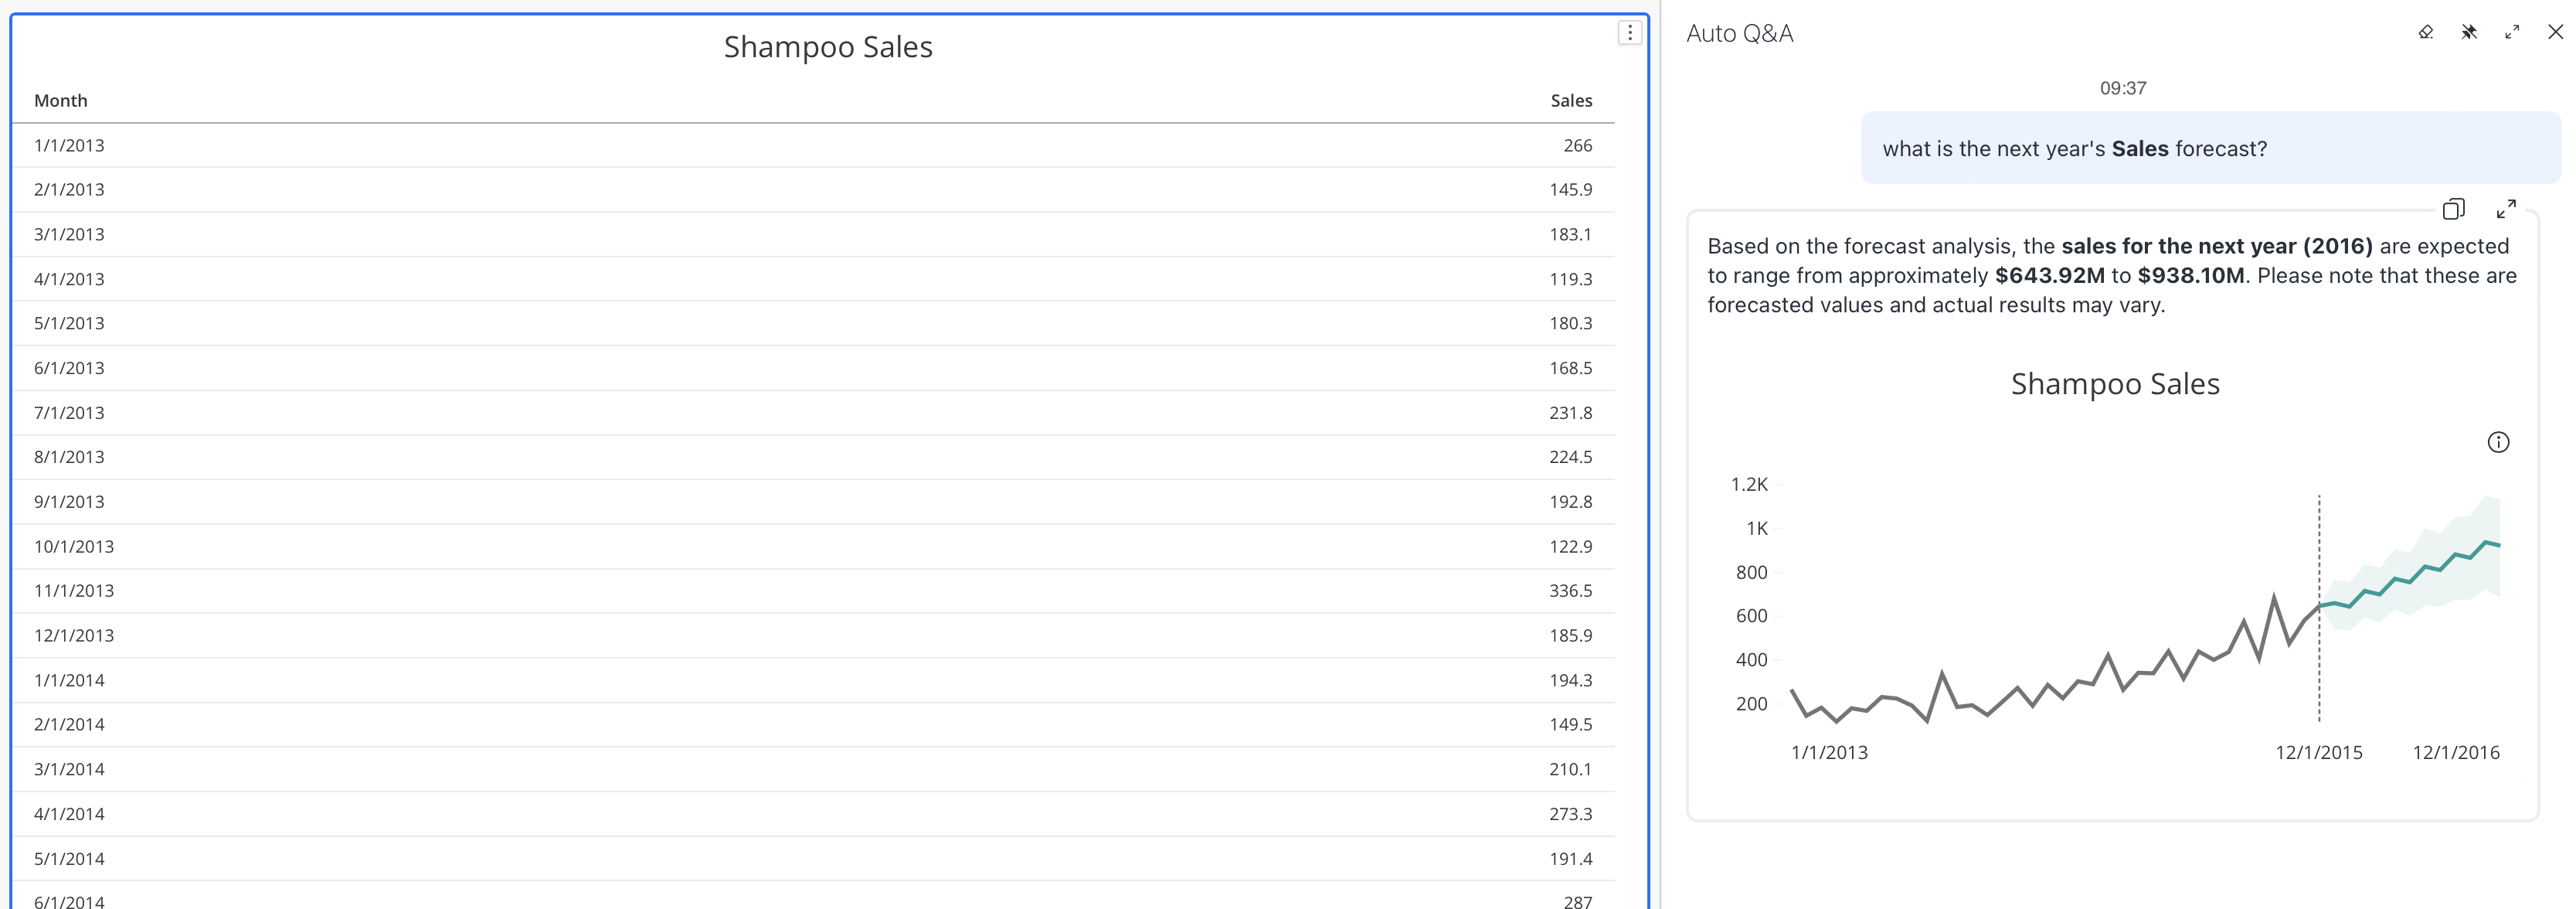
Forecast at a higher level against lower level data Start with a given monthly sales dataset. You can ask Auto Answers to forecast the sales for the next year based on monthly data.
-
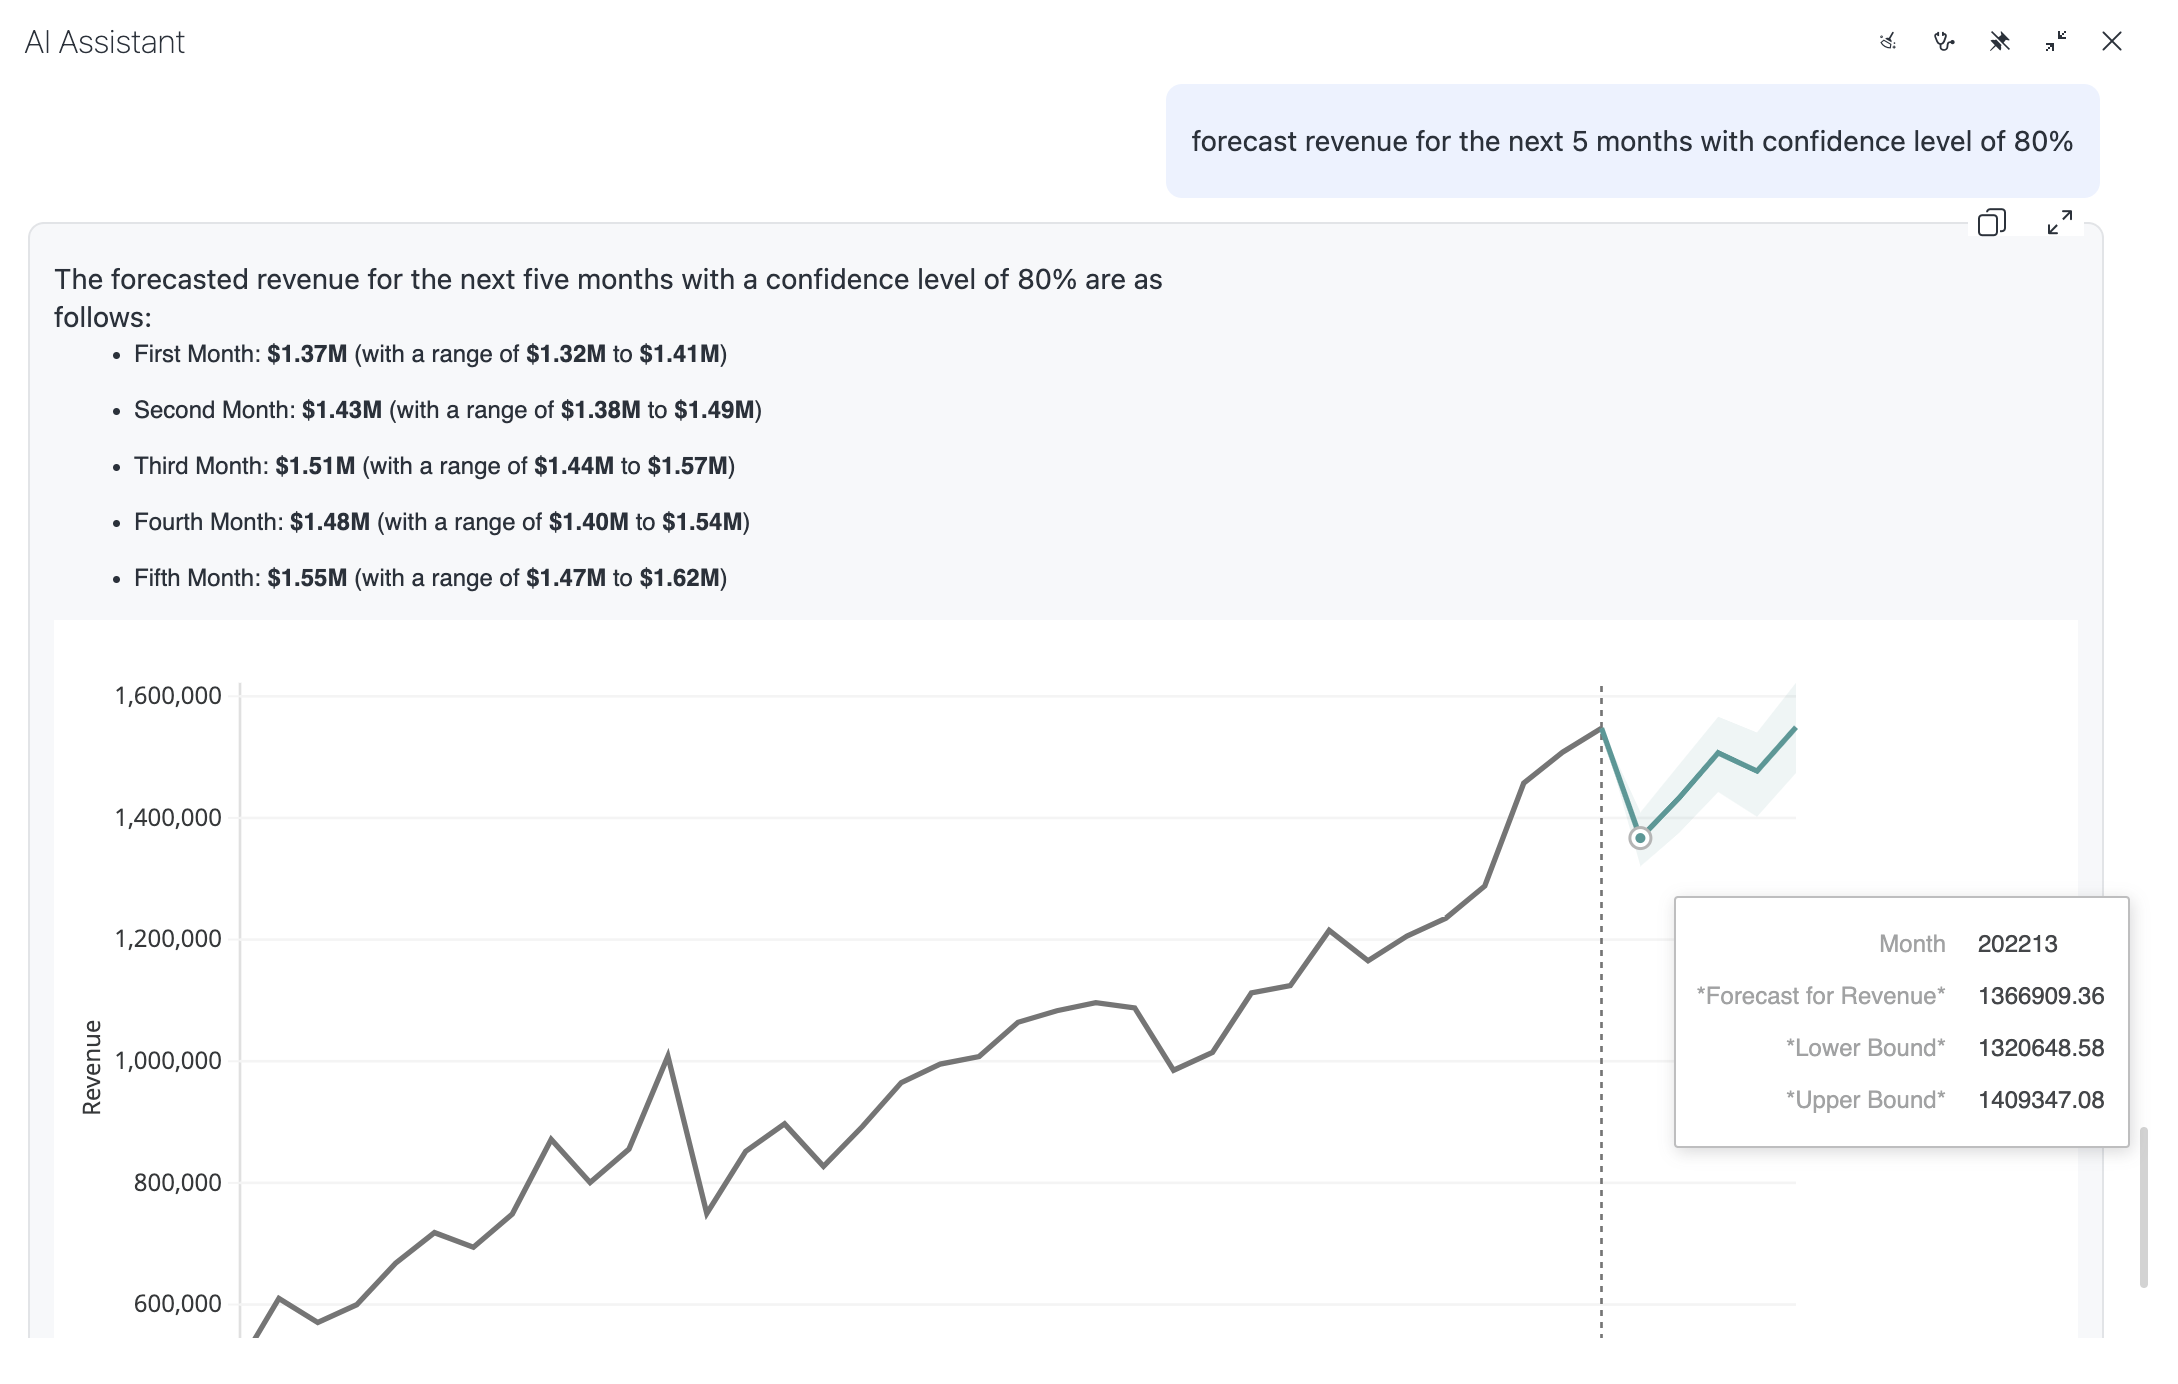
Hyper-parameters Tuning For those who want more control, there's an advanced option. You can adjust hyper-parameter values within your question. For instance, if the auto-detected seasonality doesn't yield optimal results, you can specify a seasonality length of your choice or set a specific confidence level. This flexibility extends to using different season and trend models, like toggling between multiplicative and additive models.
-
Applying Filters Predictions can also be filtered. The example below demonstrates forecasting for the next three months, considering a specific category such as music. Keep in mind that the month attribute is represented as an integer, not a time-based value.
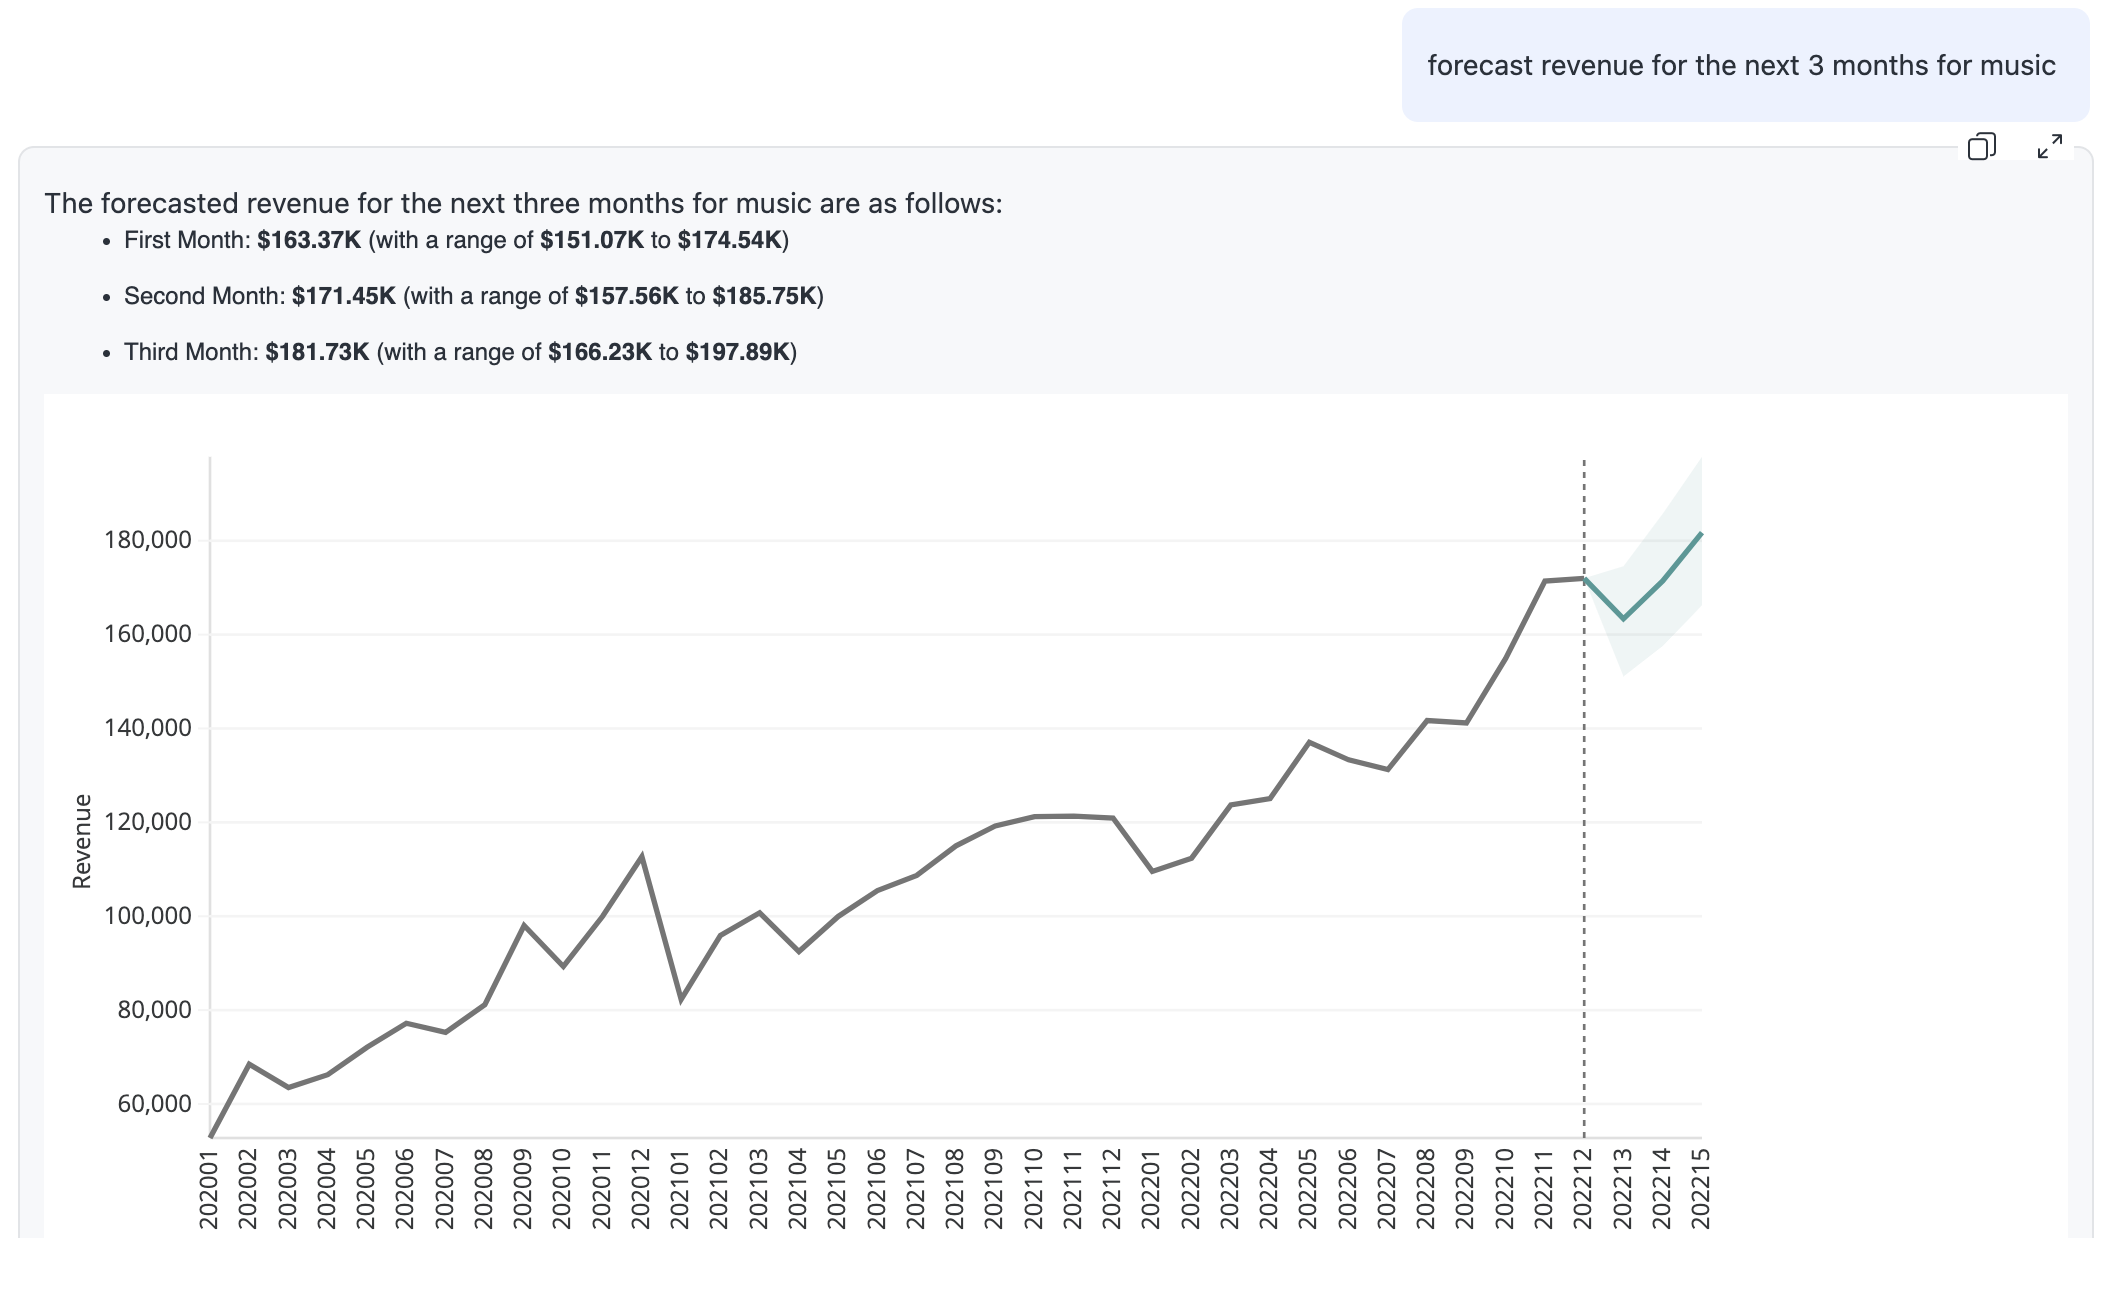
-
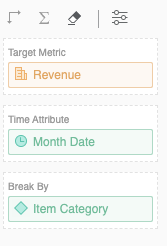
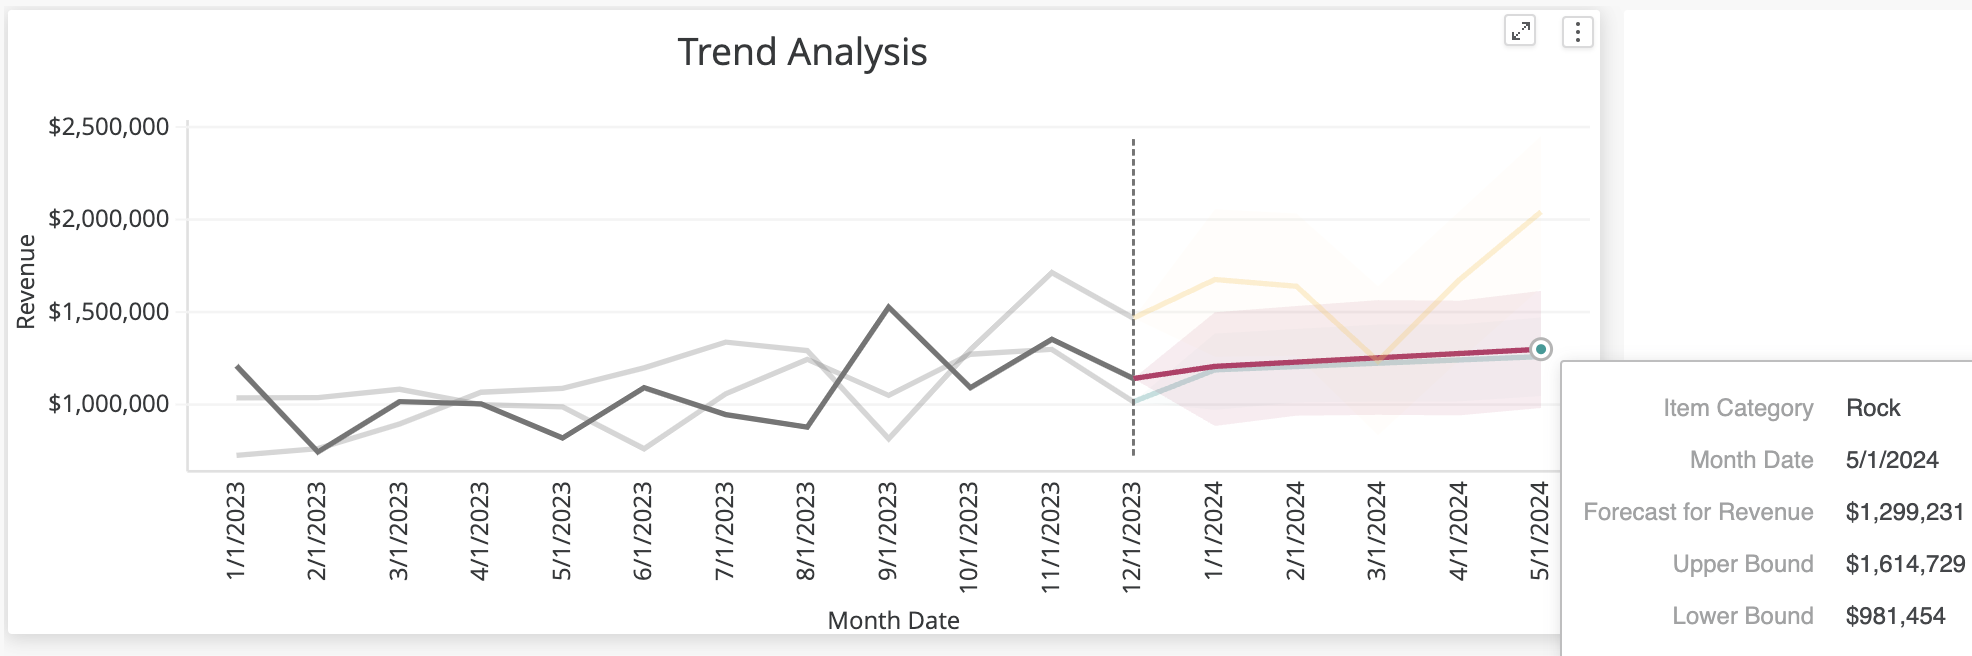
Break By: You can get predictive insights about multiple data elements using questions such as "What is the Forecast for Revenue over [Date] for each product Category?".