Strategy ONE
Key Driver Analysis
Single-factor key driver analysis empowers businesses to understand the dominant factors that influence specific outcomes. Key driver analysis drills down on individual variables to evaluate their impact and significance on a target metric. This targeted approach is particularly valuable to prioritize interventions and understand the core levers of performance.
By utilizing a blend of robust statistical methods, MicroStrategy's single factor key driver analysis tool provides users with a clear-cut and intuitive interface to discover the primary influences within their datasets. Whether you're a marketing manager, customer experience specialist, or supply chain analyst, this capability offers the clarity to focus on what matters, shape strategies around key drivers, and maximize returns on investments.
Using this diligent analytic method not only ensures precise insights, it also eliminates the clutter of multi-variate complexities, which makes the decision-making process more streamlined and effective.
Access Key Driver Analysis
Key driver analysis is available in the following ways:
-
Through the visualization gallery in a dashboard using a drag-and-drop interface to create a Key Driver visualization.
-
Auto can utilize natural language queries to perform key driver analysis
Create a Single Factor Key Driver Visualization
-
Open a dashboard for editing.
-
In the top toolbar, click

-
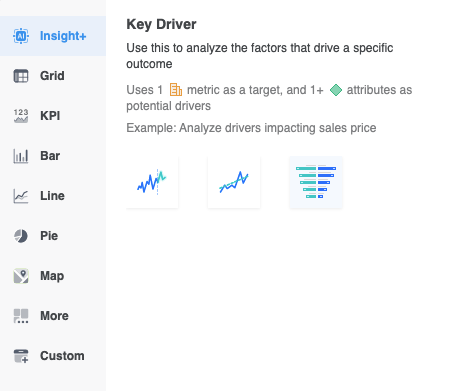
Choose Insight+ > Key Driver.
-
Drag a metric from the Datasets panel to Target in the Editor panel.
-
Drag attributes from the Datasets panel to Potential Drivers in the Editor panel.
Customize the Appearance of a Key Driver Analysis
Make your key drivers visually engaging by customizing the appearance of your Key Driver visualization. Adjust colors, fonts, and labels to match your preferences and create a chart that's not only insightful, but looks great!
By default, factors that cause a metric to increase use the first color from the chosen color palette and factors that decrease the metric use the second color from the chosen color palette. However, you can customize the color, factor labels, and text using the Format panel.
-
In the Format panel, click Text and Form
 .
. -
Under Title, select a font, size, and color.
-
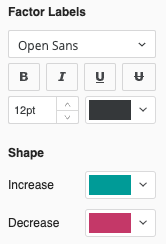
Under Factor Labels, select a font, size, and color.
-
Under Shape, select colors for increasing and decreasing the value of the analyzed object.
Use Auto Answers for Key Driver Analysis
To get started using Auto for key driver analysis, you must open Auto Answers in Library.
To harness the power of understanding pivotal influences on your business measures, ask Auto for factors that affect your metric. Simply input your query, like "What is the main driver for our sales growth?" Auto delves deep into your dataset, leveraging its intricate understanding of the data dynamics, combined with cutting-edge analytical algorithms.
The result? A straightforward, comprehensible breakdown of the primary factors influencing your specified metric, accompanied by an intuitive butterfly chart visualization to enhance clarity. In compact mode, you see the top three factors affecting your metric. By expanding the answer, you'll get a comprehensive look at all factors that contribute to the metric value, giving you a fuller picture and greater analytical depth.
Here's how you can delve into analysis using Auto. Auto is shown in expanded mode below.
-
Drivers of your metric Start with a dataset containing multiple attributes and metrics. You can ask Auto to look for factors impacting the value of a specific metric. Ask the question, "What drives Revenue?"
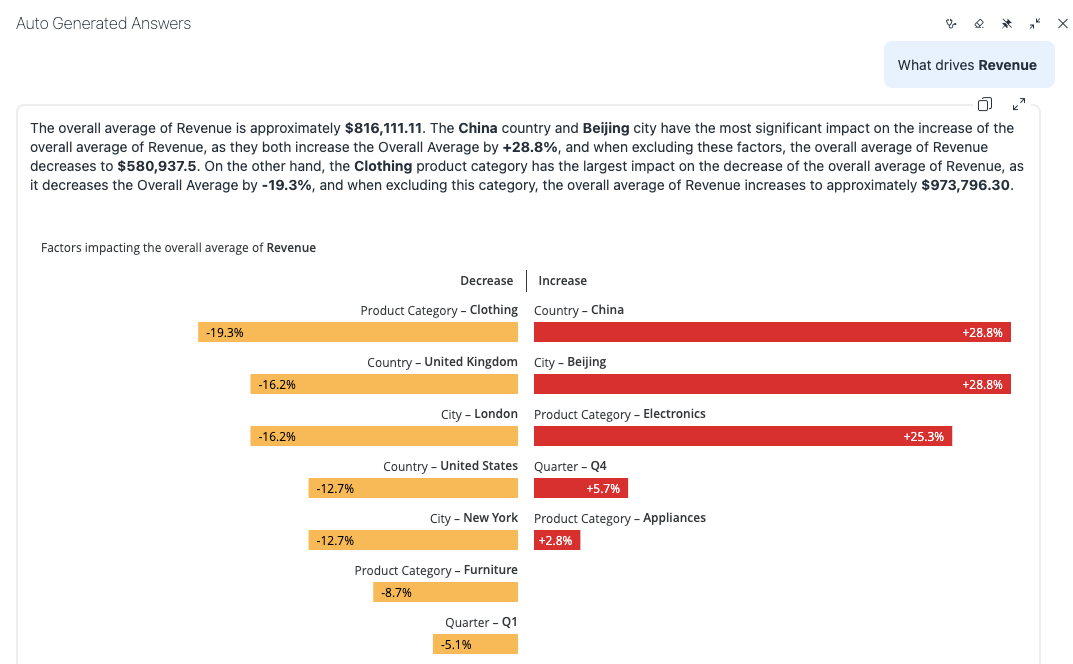
-
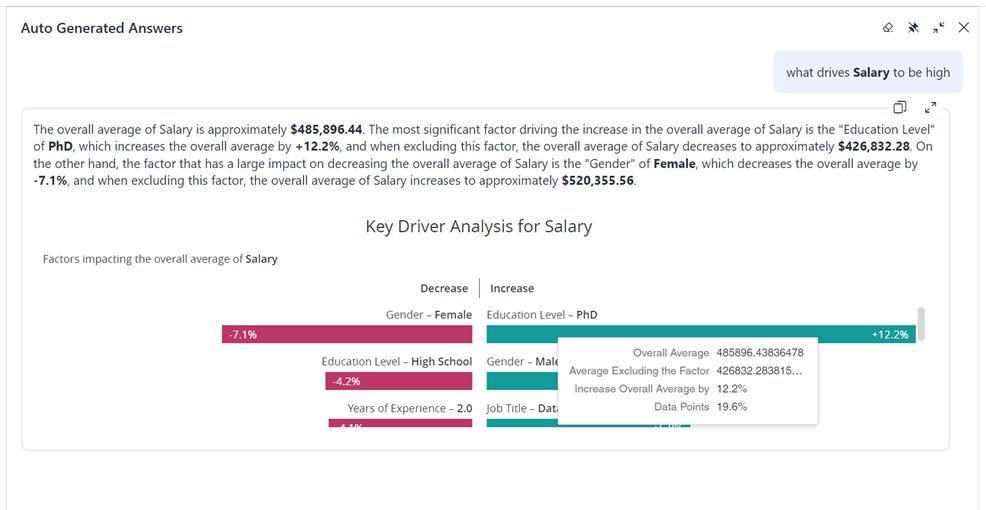
What keeps a metric at the desired level Key driver questions can be asked with specific outcomes in mind. Auto can generate a text description of the data, specifying factors that drive a metric in the desired direction.
Ask the question, "What drives Salary to be high?"