Strategy ONE
Create a Single Visualization
- Create or open an existing dashboard.
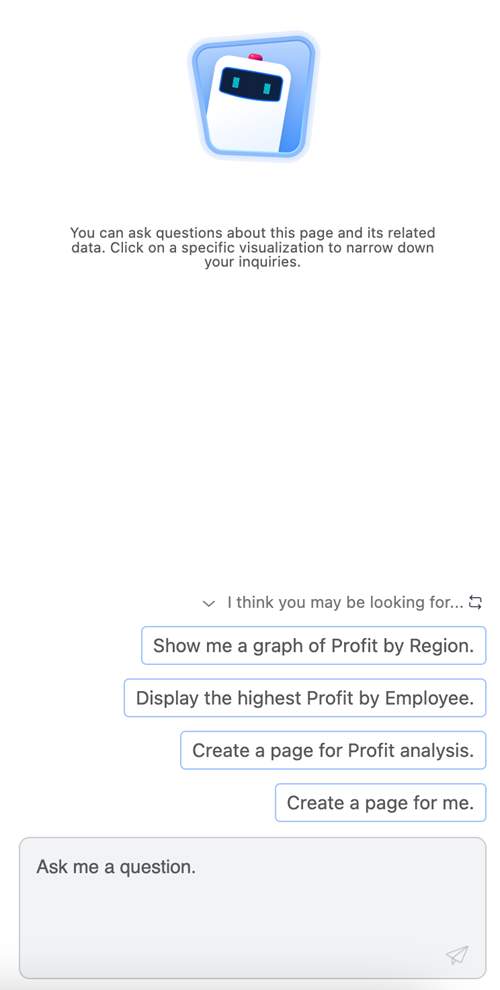
- Click the Auto Dashboard icon in the upper-right.
- Type a question or choose from the AI-generated list of content suggestions. Examples of questions depend on the attributes and metrics in your dataset.
You must have a minimum of one dataset.
![]()

-
To create a single visualization:
-
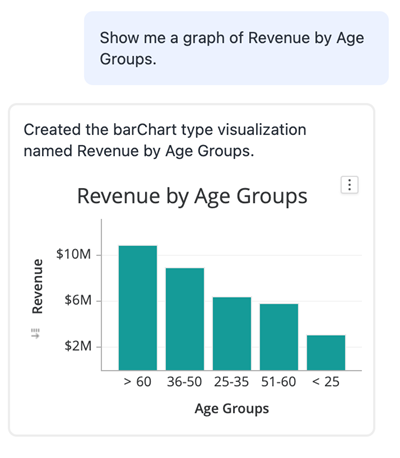
Select a suggestion or pose a business question to create a single visualization as done in Auto Answers.

-
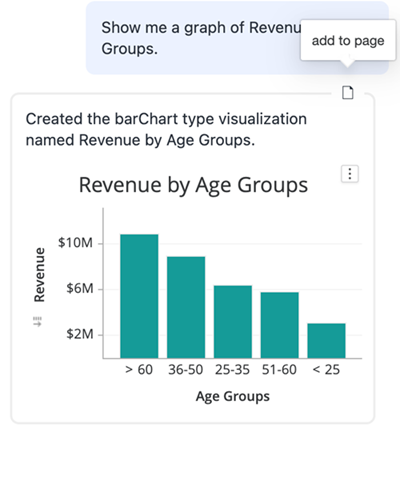
The visualization is created in the Auto panel. To move the visualization, hover your mouse over the visualization and click the add to page icon.

-
You can refine the generated visualization by providing follow-up instructions to Auto Dashboard. Supported interactions include:
-
Sort on grid or graph
-
Change the visualization type
-
Add, remove, or replace an object in the visualization drop zone
-
Change the visualization title
-
Enable subtotal
-
Create a derived metric
-
Create a view filter
-
-
- Edit content generated by Auto Dashboard as you would any other content.
- To generate more pages or content using Auto Dashboard, click the Auto Dashboard icon and enter a new query or select a new suggestion.
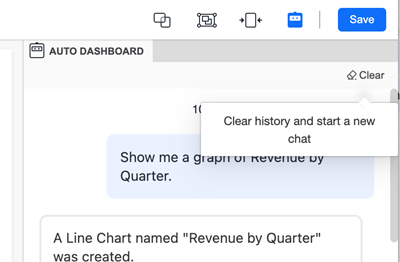
- Click Clear to clear the chat history and start a new chat.

