Strategy ONE
Troubleshoot Key Driver Analysis
Tips for Key Driver Analysis Questions
-
Use Natural Language Auto understands conversational language. Frame your questions in a natural way, as if you were asking a colleague.
-
Include Relevant Attributes Include the necessary attributes and metrics in your question to ensure the Auto understands the context. If attributes are not specified, Auto runs the analysis for all attributes in the dataset.
-
Leverage the auto-complete feature For optimal key driver analysis using Auto, it's recommended to choose metrics and attributes from the auto-complete suggestions. This ensures precise understanding by Auto for accurate key driver analysis.
-
Avoid Ambiguity Keep your questions clear and unambiguous. Complex or convoluted queries might lead to inaccurate responses.
-
Expand for Clarity If you need to see more detailed information or display the entire set of data points, expand the visualization. This enhances the readability of the chart.
Best Practices When Using the Key Driver Analysis Visualization
Use High-Quality Data for Key Driver Analysis While Strategy performs lightweight data processing before key driver analysis, such as eliminating some missing metric data, results can be compromised if there's a significant amount of missing metric data. For accurate key driver analysis results, it's important to ensure that your data is of good quality and substantial volume.
Optimize Key Driver Analysis Visualization Interpretation
Get the most out of your key driver line chart visualization.
Hover for Insights Hover your cursor over a data point in the Key Driver Analysis visualization to reveal a tooltip. It contains detailed information about key driver analysis values.
Troubleshooting
-
Top factors In Auto Answers, only the top bottom three key factors can be shown in the summary text. We do not recommend explicitly asking for data outside of the range. Use expanded mode in Auto Answers to see the entire visualization and all factors impacting your metric.
-
Impact threshold Only the drivers whose impacts are greater than 2% appear in the visualization.
-
Numerical attributes Currently, we regard every value of a numerical attribute as a single potential drive. This may change in the future.
-
Data volume limits The data must contain at least eight rows. The maximum size of the data file is 40 MB.
-
Advisory The key driver analysis is designed to aid decision-making, but may not guarantee absolute accuracy. The insights offered should be used as a supplementary reference. It's essential to understand that correlation does not imply causation. Users are advised to exercise their own discretion and judgment when interpreting the results.
FAQs
What key driver analysis method is used?
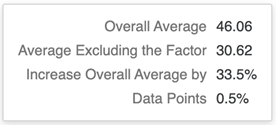
Strategy produces the key factors by calculating the impact value on the average value. The formula of impact value is:
Impact = (Overall Average Value - Average Value Excluding the Element) / ABS(Overall Average Value)
The impact value can reflect how the key driver influences the overall average. For example, you have a Data Scientist Salary dataset and the Employee Location is US has a 50% impact. This means the job location of a data scientist in the United States increases the overall average salary worldwide by 54%.
Can hyper-parameters be adjusted for key driver analysis?
Currently, Strategy does not expose the hyper-parameter.