Strategy ONE
NTileValue
NTileValue distributes the values in the metric by value ranges over a user-defined number of buckets, sorted in either ascending or descending order. Each bucket is the same size in terms of the range of values contained in the bucket, but the number of elements per bucket is not equal. This is an OLAP function.
Syntax
NTileValue <Ascending, Segments, BreakBy> (Argument)
Where:
Ascendingis aTRUE/FALSEparameter that designates the organization of data within the NTiles.Segmentsis a positive integer designating the number of buckets in which the values are distributed.BreakByis the parameter that sets the attribute determining where the calculation restarts.Argumentis a metric representing a list of values to be distributed into buckets.
Example
Example 1: If you define the Segments=4, and the minimum value in the range is 5 and the maximum is 105, the bucket distribution is as follows, where x is the value:
- 5 £ x < 30 in bucket 1
- 30 £ x < 55 in bucket 2
- 55 £ x < 80 in bucket 3
- 80 £ x £ 105 in bucket 4
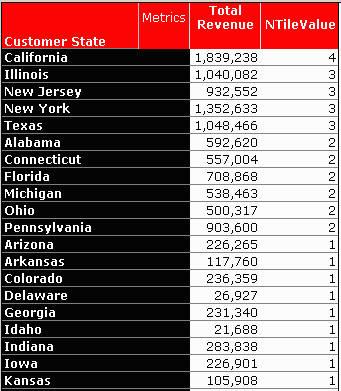
Example 2: This example shows a report where the customer states are sorted based on revenue and then placed in buckets based on the value range to which they belong. The number of buckets (segments) is defined as 4. The range of values is divided by the number of buckets and the result is used to define four value ranges into which all the values fall. The report includes the attribute Customer State and the metrics Total Revenue and NTileValue. The syntax for the NTileValue metric is as follows:
NTileValue<Segments=4>([Total Revenue])
The resulting report displays the 48 states distributed across 4 buckets. Notice that the number of elements in each bucket is not equal as more values fall into one range than another. A portion of the resulting report is displayed as follows.
Example 3: Histogram
The reports and components used in this example are available in the MicroStrategy Tutorial under the following folder: MicroStrategy Tutorial\Public Objects\Reports\MicroStrategy Platform Capabilities\Advanced Analytics\Statistics and Forecasting\Histogram
How are My Customers Distributed (Classified) Based on Sales Data?
You are interested in finding out how your customers are distributed based on their contributions to sales data. This example segments customers into 10 separate groups, with each group representing the customers within a 10% increment of sales. For example, the first segment includes the customers who spend in the lowest 10% of the sales, while the final, tenth segment includes the customers who spend in the top 10% of the sales.
This example uses the following concepts:
- Analytical functions: NTileValue
- Custom group
NTileValue distributes values into buckets based on minimum and maximum values. These tiles are assigned an integer and the contents of each bucket denoted accordingly. For example, all customers that fall in the first bucket are assigned a 1, all customers in the second bucket are assigned a 2, and so on. This function is computed by Intelligence Server. The metric using NTileValue is then used to create a dynamic classification of Customers using a custom group.
To create a general solution that can be used by different users, use object prompts (see instructions below).
Create the following object prompts:
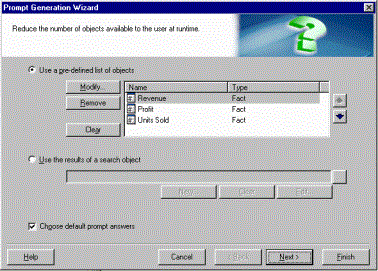
- Choose a base fact. This object prompt asks the user to select a fact: Revenue, Profit, or Units Sold.
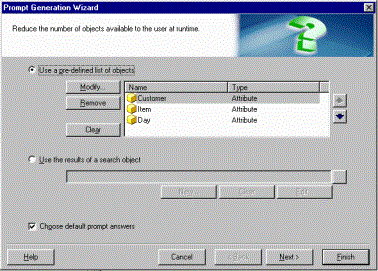
- Choose a sample set level. This object prompt asks the user to select an attribute: Customer, Item, or Day.
Once you have identified the basic fact and attribute to analyze, you can start building other objects. Take the following steps:
- Create a metric defined as follows:
Sample Set Metric = Sum(?[Choose a base fact]){~, ?[Choose a sample set level]} - To put the value in the proper buckets (tiles), create another metric defined as:
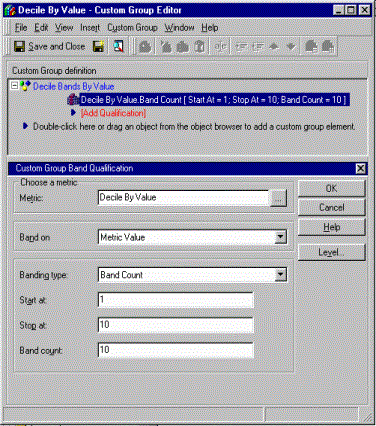
Decile By Value = NTileValue<Segments=10> ([Sample Set Metric]) - Create a dynamic classification of the subject attribute (Customers, Item, or Day) by building a custom group using banding. Use the metric Decile By Value, the banding type "band count" and set the band count to 10, starting at 1 and stopping at 10.
-
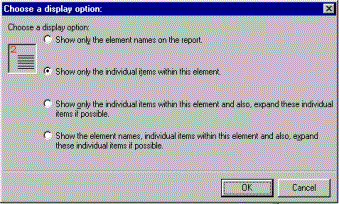
Choose to show only individual items within this element since the objective is to build a graph (histogram) for this custom group.
- Count the number of elements in the new classification to display a histogram. To do this, create a dummy metric defined as follows:
Count of Samples = Count(1){~}
- Since there is no column to perform the count, define the metric so that the database can calculate how many attribute elements are in each custom group element.
- Add the Decile by Value custom group to the row axis, and the Count of Samples metric to the column axis.
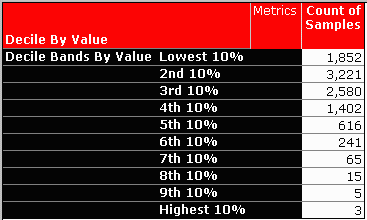
- Execute the report with attribute Customer and fact Revenue, and the Decile Histogram, in Grid mode, displays as follows:
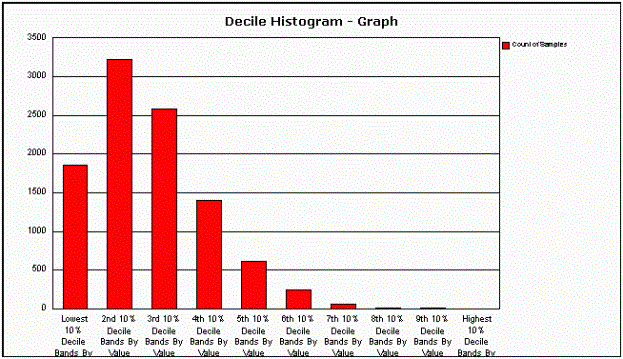
The same report, in graph mode, appears as follows:
The SQL generated for the Decile by Histogram is as follows:
Pass0 - Duration: 0:00:00.25
select a11.[CUSTOMER_ID] AS CUSTOMER_ID,
	a11.[TOT_DOLLAR_SALES] AS WJXBFS1
from [CUSTOMER_SLS] a11
Pass1 - Duration: 0:00:00.09
create table ZZT1Y02011CMQ000 (
	CUSTOMER_ID SHORT,
	DA56 LONG)
Pass2 - Duration: 0:00:00.00
[An Analytical SQL]
Pass3 - Duration: 0:01:13.64
insert into ZZT1Y02011CMQ000 values (1499, 1)
Pass4 - Duration: 0:00:00.32
select a11.[DA56] AS DA56,
	count(1.0) AS WJXBFS1
from [ZZT1Y02011CMQ000] a11
group by a11.[DA56]
Pass5 - Duration: 0:00:00.03
drop table ZZT1Y02011CMQ000
- Pass0 computes the revenue for each Customer using the Sample Set Metric.
- The next three passes (Pass1, Pass2, and Pass3) prepare the dynamic classification of Customer for the custom group. This series of SQL passes essentially builds a dynamic lookup table for the classification that is requested. The column DA stands for Dynamic Attribute. The Intelligence Server computes the NTileValue function. This is indicated by
[An Analytical SQL]in Pass3. The value is then inserted, with the new classification, into the dynamic lookup table for the custom group. - Pass4 calculates the number of customers that belong to each custom group element.
- Pass5 drops the temporary table.
