Strategy ONE
NTile
NTile functions are used to group the values in an ordered list into one of several buckets or NTiles. For the NTile function, the buckets are calculated so that each bucket has exactly the same number of rows assigned to it or at most one row more than the others (the exception is that identical value rows are placed in the same bucket). For example, if you have 100 rows in a partition and define an NTile function with four buckets, 25 rows will be assigned a value of 1, 25 rows will have value 2, and so on. These buckets are referred to as equiheight buckets.
If the number of rows in the partition does not divide evenly into the number of buckets, then, barring identical value rows, the number of rows assigned per bucket will differ by one at most. The extra rows are added to buckets using the calculations ceiling(1*(buckets/remainder)),...,.
ceiling(remainder*(buckets/remainder))
For example, if there are 103 distinct value rows in a partition which has an NTile<Tiles=5>() function, the first 20 rows will be in the first bucket, the next 21 in the second bucket, the next 20 in the third bucket, the next 21 in the fourth bucket, and the final 21 in the fifth bucket. The calculations ceiling(1*(5/3))=2, ceiling(2*(5/3))=4, and ceiling(3*(5/3))=5 include one of the extra three rows each in the second, fourth, and fifth buckets.
NTile distributes the values in the specified metric, sorted in either ascending or descending order, over a user-defined number of buckets. Each bucket has an equal number of elements (if possible). This is an OLAP function.
Syntax
NTile <Ascending, Tiles, BreakBy> (Argument)
Where:
Ascendingis aTRUE/FALSEparameter that designates the organization of data within the NTiles.BreakByis the parameter that sets the attribute determining where the calculation restarts.Tilesis a positive integer that designates the number of buckets or NTiles.Argumentis a metric representing a list of values to be distributed equally (if possible) intonbuckets.
Example
Example 1: If you define Tiles=4 for a metric that contains 20 values, the function distributes the numbers as follows:
- Values 1 through 5 in bucket 1
- Values 6 through 10 in bucket 2
- Values 11 through 15 in bucket 3
- Values 16 through 20 in bucket 4
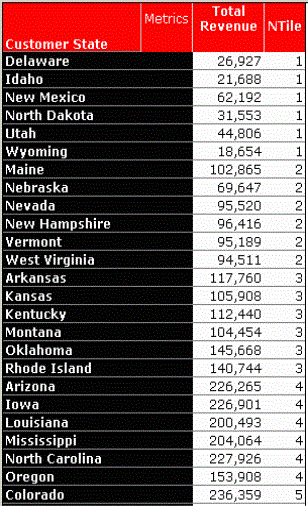
Example 2: This example shows a report where the customer states were sorted based on revenue and then divided among a specified number of buckets. The number of buckets is defined as 8. The report includes the attribute Customer State and the metrics Total Revenue and NTile. The NTile metric is a derived one, the syntax for which is as follows:
NTile<Tiles=8>([Total Revenue])
The resulting report divides the 48 states into 8 NTiles, each containing 6 elements (states). Within each band the data is sorted in ascending order by the attribute Customer State. A portion of the report is displayed as follows.

