Strategy ONE
Metric Expressions
Metrics are MicroStrategy objects that represent calculations performed on data. You can define metrics by using the available functions to analyze your data and determine business measures.
Formula and dimensionality are the two important components in a metric. While all metrics have a formula, not all of them have dimensionality.
- Formula: Is a mathematical expression using one or more functions, applied to the data to be used in the calculation (facts, attributes, constants, or metrics). In SQL, the formula commonly becomes part of the SELECT clause of the SQL command.
You can re-use the same formula in multiple metric definitions. This type of formula is called a base formula, which can contain arithmetic operators, attributes, facts, group functions, and non-group functions. A base formula does not have dimensionality (see below). For more information on base formulas, see the Basic Reporting Help.
- Dimensionality: determines the attribute level at which a metric is calculated. After deciding on the target (the attribute), in dimensionality you can further define filtering and grouping involved in the metric. All metrics, by default, calculate at the report level.
Other optional components of a metric include condition (filter) and transformation. For the purposes of this book, we only discuss formula and dimensionality related to the use of functions. For information on all metric components, including additional information and examples of level metrics, conditional metrics, and transformation metrics, see the Advanced Reporting Help.
There are two types of metrics:
- Simple metric: has a formula and dimensionality (level). It can stand alone or be used as a building block for a compound metric. A simple metric must use at least one group-value function, such as Sum or Avg. It can also contain a non-group function or arithmetic operator, in addition to the required group function, for example,
Sum(Revenue - Cost){~+}; however, the outermost formula must be a group function. - Compound metric:isa combination of expressions that, through the use of functions, are themselves metrics. In other words, a compound metric is made of more than one complete metric. Any metric that is not a simple metric is a compound metric by default. For example, all arithmetic functions that are used as the root to connect two metrics yield compound metrics.
A compound metric cannot have dimensionality placed on the entire metric, although dimensionality can be set separately on each of its component metrics.
A quick way to check whether a metric is simple or compound is through the Metric Editor, where you can click the Subtotals/Aggregation tab and check if the Allow Smart Metric option is enabled. If it is, then it is a compound metric; if not, it is a simple metric.
The following three types of functions can be used to build simple and compound metrics:
- Single-value functions
- Group-value functions
- OLAP functions
The optional condition (filter) component of a metric can contain logical and comparison operators. See the Filter Expressions subsection for details.
While the single-value and group-value functions are used to create both simple and compound metrics under different circumstances (see examples to follow), the OLAP functions always yield compound metrics, due to their unique characteristics (see OLAP (Relative) Functions).
Examples of Dimensionality in Metrics
As mentioned previously, all metrics have a formula, but not all metrics have dimensionality. The following examples and diagrams illustrate the formation of simple and compound metrics, as well as formula and dimensionality.
Example 1: Simple Metric with Dimensionality at the Report Level
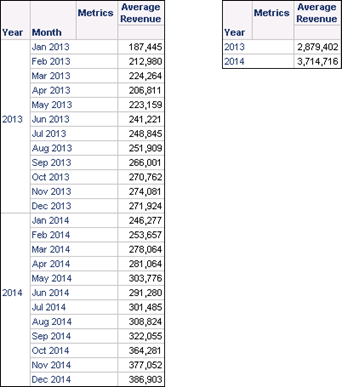
Avg(Revenue) {~+}
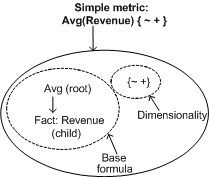
In this example, the expression is Avg on the fact Revenue. Together they make up the base formula. This simple aggregation metric has dimensionality, which is indicated by {~+}, meaning that the metric is calculated at the lowest level on the report. For example, if a report contains revenue by year and month, the numbers are calculated to reflect monthly sales data. If month was removed from the report, the metric would automatically be calculated at the new report level, which would reflect yearly sales data.
All group-value functions are aggregation functions, which, when used alone, yield simple metrics.
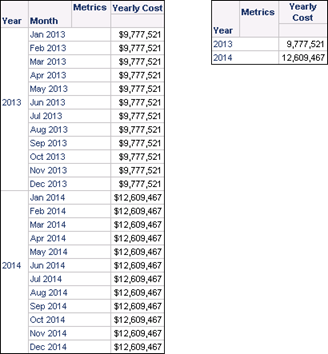
Example 2: Simple Metric with Dimensionality at Year Level
Sum(Cost) {~ +,year +}
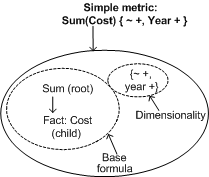
In this example, the expression is Sum on the fact Cost. Together they make up the base formula. This simple aggregation metric has dimensionality. However, unlike in Example 1, dimensionality is set at the level of the attribute Year, indicated by {Year +}. This means that if a report contains cost by year and month, the numbers are calculated to reflect yearly cost data.
Example 3: Dimensionality for Compound Metrics
Avg(Revenue){~ +}/ Sum(Revenue) {~ +}
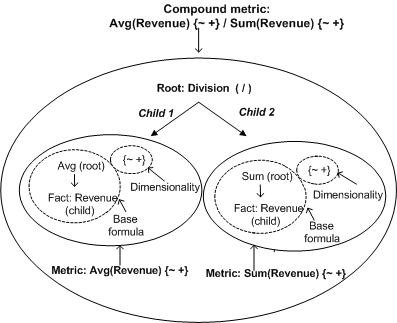
Dimensionality of compound metrics is defined by the other metric definitions that are combined to create a compound metric. In this example, the root Division (/) has two children, Avg(Revenue) and Sum(Revenue), both of which are simple metrics themselves, and each of which has its own dimensionality. The whole expression itself is a compound metric because it uses two metrics and does not have its own dimensionality.
Accessing Metric Functions
You can access functions to create metrics in several ways. You can use the Metric Editor when creating a new metric in a project. To create a derived metric, which is a metric based on the existing data in a report, use the options from within a report to insert a new metric.
You can also create metrics in Command Manager. For more information on this method, see the Advanced Reporting Help.
Metric Editor
The Metric Editor is used to create new metrics and edit existing metrics in MicroStrategy. The interface allows you to build metric expressions and validate them.
To Access the Metric Editor Using Developer
- Log in to a project.
- In the MicroStrategy Developer File menu, point to New > Metric. The New Metric dialog box is displayed.
- Choose a Metric template and click OK. The Metric Editor displays.
- Build the metric expression, accessing the functions in one of the following ways:
- Expand the Functions and Operators folder using the drop-down list or shortcut list in the Object Browser pane. Then expand the Functions, Operators, or Plug-In Packages folder to access the various categories of functions and operators.
- Click
 (Insert Function) in the Definition pane. The Insert Function wizard opens.
 - Enter the function name and all required metric syntax directly in the Enter your formula here box.
You can also edit existing metrics by using the Metric Editor. To access the editor, select the appropriate metric in the folder list, object browser, or report view. Then right-click and select Edit from the shortcut menu. The Metric Editor opens with the selected metric loaded.
To Access the Metric Editor Using Web
- Log in to a project.
- From the MicroStrategy Web home page, click Create Metric.
- In the pane below, select the function to use to calculate data in the metric. You can narrow the list of functions displayed in the pane by doing one of the following:
- To search for the function by name, type the function's name in the search field.
- Choose a function category from the drop-down list, such as Math Functions or Financial Functions. The pane is updated to include only the functions that belong to the selected category.
- The Function Editor opens, with different options available depending on the type of function you selected above:
- If you selected a grouping function, such as Sum, Average, First, or Maximum, you are presented with options to define the metric's expression, as well as optional components such as the level, condition, and transformation. Perform the following steps:
- Define the metric's expression by doing one of the following:
- To specify the expression by typing the name of an object, type the name of the object in the Expression field. As you type, matching objects are displayed in a drop-down list. You can click an object or continue to type. You can type multiple objects, such as Revenue-Profit.
- To specify the expression by choosing an object, click the Browse icon. The Select an Object dialog box opens. Navigate to and select an object, or search for the object.
- You can further define the metric by adding a level, condition, and transformation.
-
If you selected a non-grouping function, such as data mining, date, OLAP, and ranking functions, you are presented with options to define the input values (called arguments) for the function, as well as any parameters you can use to determine the behavior of the function. For example, the NTile function has two parameters, Ascending and Tiles. Ascending controls whether the NTiles are ordered in ascending or descending order, while Tiles sets the number of splits. To view a list of the arguments and parameters for the function, click Details at the bottom of the dialog box.
Perform the following steps:
- For each argument listed, type a value or click the Browse icon to find the metric, fact, prompt, or other compatible object to use as input values of the function.
- For each parameter listed, type a value or select the parameter value from the drop-down
- Click Save. For additional steps to define metrics using Web, see the Strategy Web Help .
Creating Derived Metrics
You create derived metrics based on objects already present in the report.
To Create Derived Metrics
- Log in to the project.
- Begin to create the derived metric:
- Using Developer, from the Insert menu in the Report Editor, select New Metric. Or, right-click above a metric heading in the Report Grid, point to Insert > New Metric. The Input Metric Formula dialog box is displayed.
- Using MicroStrategy Web from the Data menu in the Report Editor, select Insert New Metric. The Metric Editor is displayed.
- Build a metric using the available report objects.