MicroStrategy ONE
Graphs
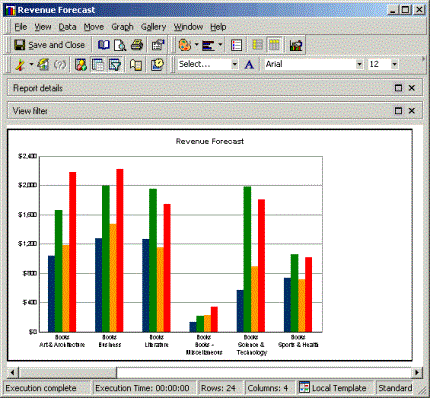
A graph report is a representation of data in a visual format that can help you see overall trends easily, identify medians and exceptions, and so on. You display report data as a graph using Graph view. There are many different graph styles you can choose from to display your report data most effectively. The following figure displays the Graph view of a report in the bar graph style.

The graph report above and the grid report on the previous page are the same report, seen in two different views. Comparing these two views of the same data helps you see how a graph report can be more useful than a grid report for identifying trends, in this case, trends across certain products. The grid report is generally more useful than a graph report for identifying specific numbers you may need for financial reports and so on.
To see a report in Graph view in MicroStrategy Web, from the toolbar click the Graph icon  .
.
