MicroStrategy ONE
Use Bots
-
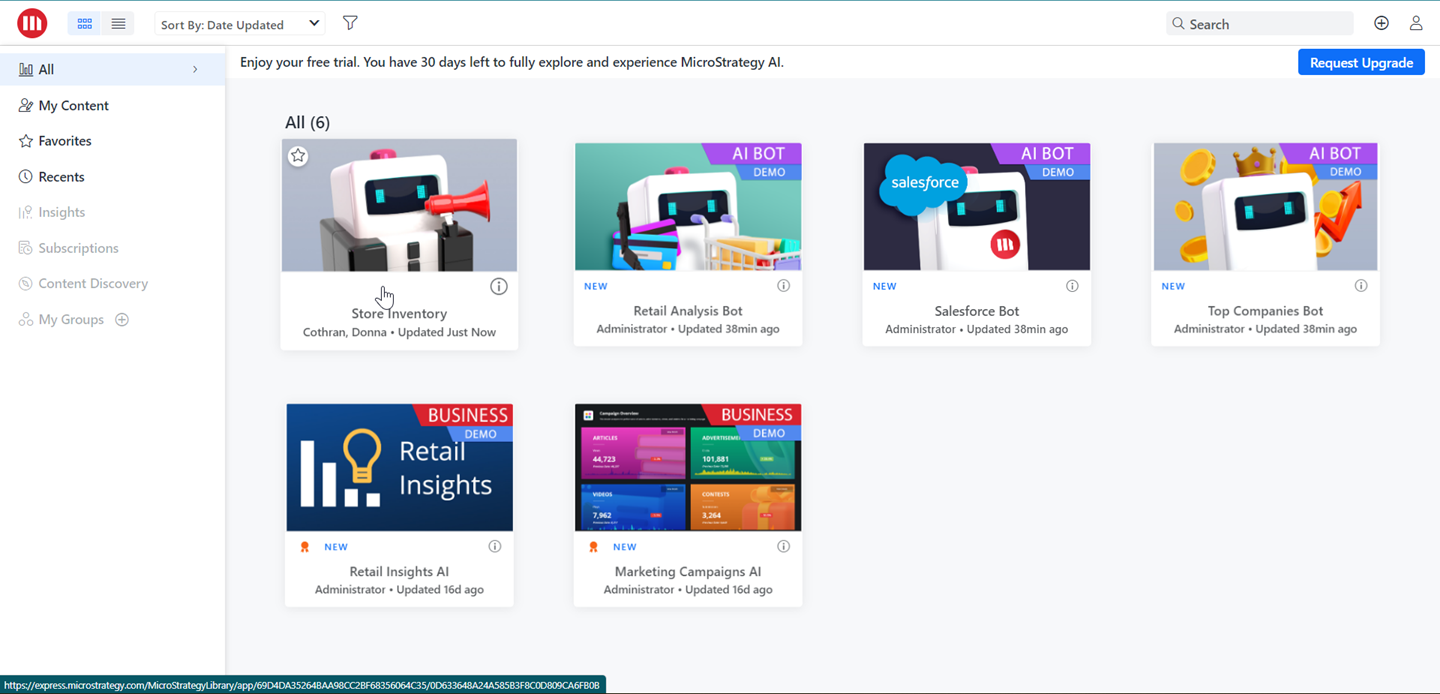
Select your bot.
-
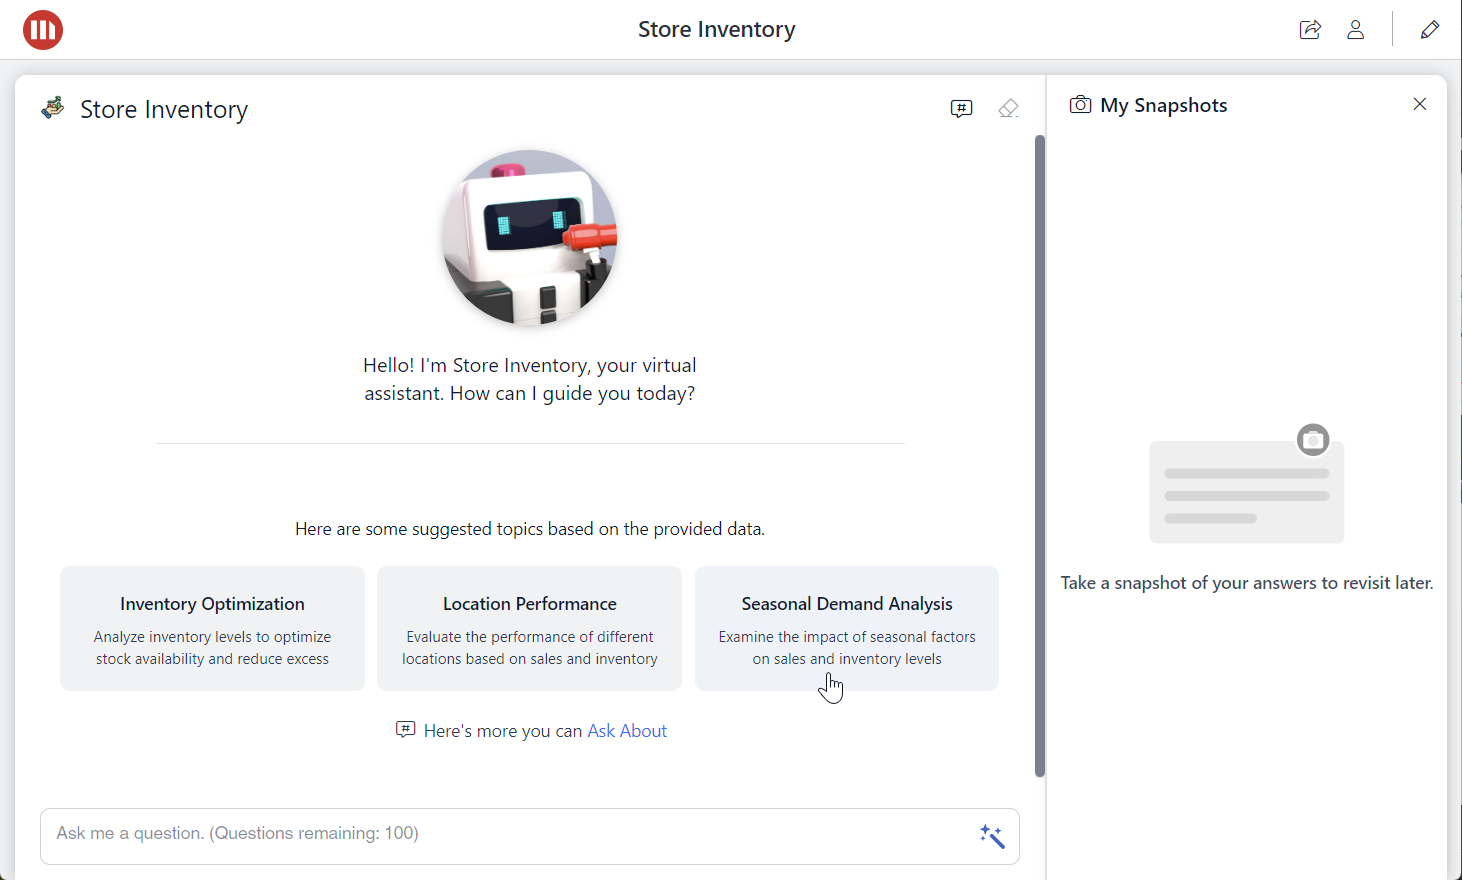
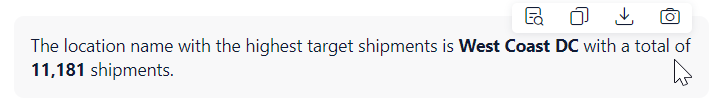
Click one of the suggested questions or enter a question that allows you to view the best visualization type for your data.
-
You can ask more questions, click
 to have the bot suggest more topics, or click
  to clear the chat history and start a new chat.
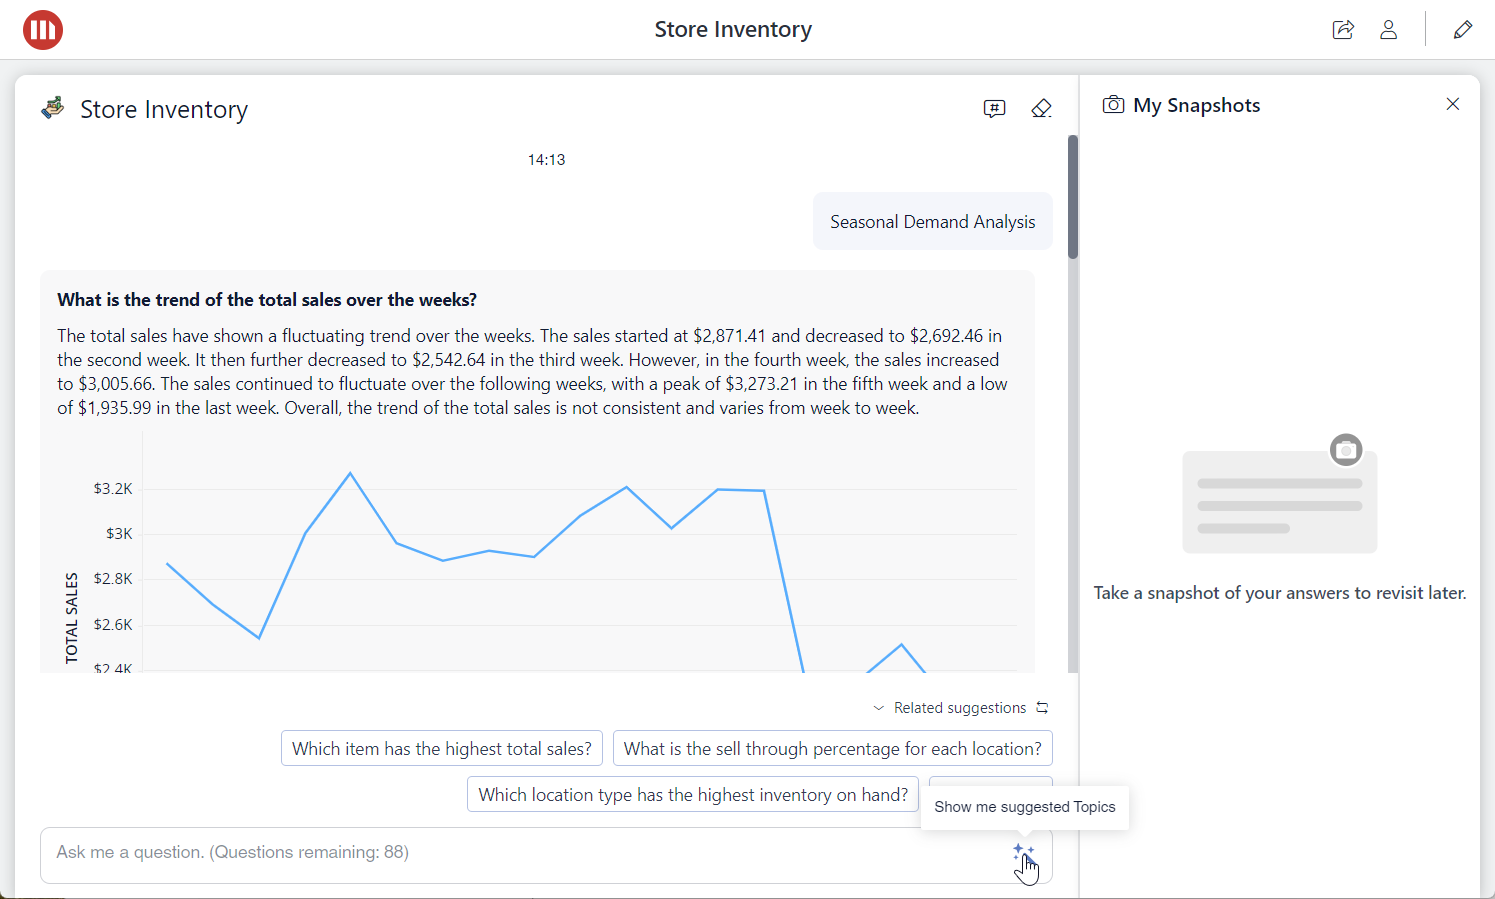
-
Click
 to display information about the attributes and metrics in the dataset.
 -
Expand attributes to display a description and samples. Click
 to generate suggested questions related to the current object.
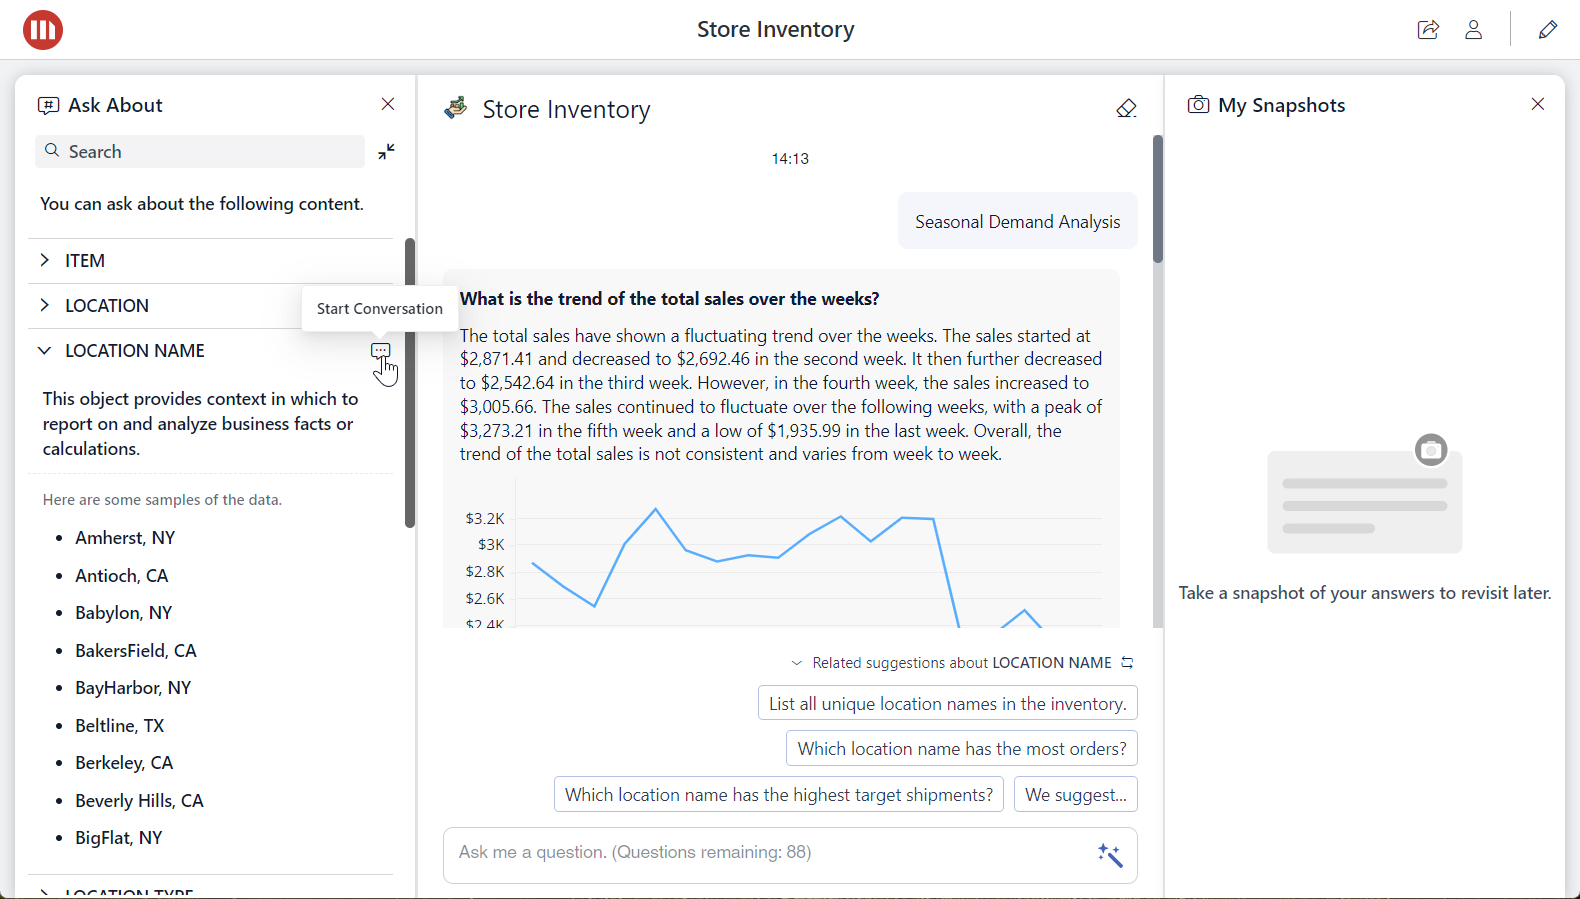
-
Once the Bot responds, hover over the message and click one of the icons to copy or download the message, get insights on how the Bot interpreted and executed your question, or save the message to My Snapshots.
 Click here for useful information about snapshot categories.
Why is a snapshot labeled as Uncategorized then moves to a category?
The Bot automatically categorizes an answer you save as a snapshot. The process sometimes takes some time. Before the Bot returns a category result, the snapshot is categorized as Uncategorized. It will then move to the correct category after the Bot returns a result.
What is the Others category?
Others is a predefined category in MicroStrategy Library. When you create a Bot, it generates five categories to categorize your snapshots. When you take a snapshot, the Bot assigns the snapshot to the most suitable category. If the Bot can't categorize the snapshot into any of the existing categories, the snapshot is moved to Others.
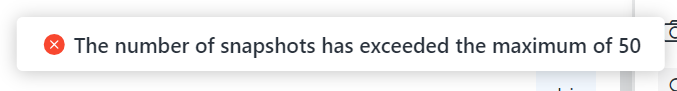
How many snapshots can you add in each Bot?
You can add a maximum of 50 snapshots for each Bot. If you exceed this limit, an error message appears.
Understanding the Response
Bot responses are comprised of natural language text and visualizations. Bot supports a range of visualization types. If you ask a question that requires specific visualizations, ensure that the chosen visualization type is one of the following supported types:
- Forecast Line Chart
- Linear Trend Line Chart
- Key Driver Analysis
- Grid
- Vertical Bar Chart
- Pie Chart
- Line Chart
- KPI
- Heat Map
- Geospatial Service (Mapbox)
Only one metric is supported.
Ring chart is not supported.
Some line chart subtypes are not supported.
Attributes are not supported.
Response Limitations
- The Bot displays only the most recent 30 messages.
-
If the response includes many data points, the visualization displays limited data (up to 1,000 rows) to focus on clarity and readability.
-
Updates to themes in the Appearance panel are not applied to previous visualization results.