MicroStrategy ONE
N-Tile
The N-tile function, which is also referred to as segmentation, sets up numbers of groups, or tiles, for a metric. Examples of required parameters are the number of groups and whether they should be sorted in ascending or descending order.
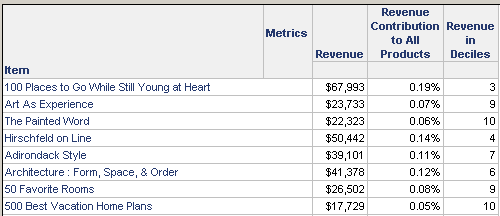
An example of an N-tile function in use is displaying what items are in the top 10% of sales, the next 10%, and so on. Use the N-tile function with the Revenue metric. Because the results are in tenths (ten groups of ten each), the number of tiles is ten. To assign the number one to the top 10%, sort the values in descending order. The metric's definition is NTile<Tiles=10, Ascending=False>(Revenue). This decile revenue metric is used on the a report with a contribution and revenue metric. Only eight rows of the report are displayed below:

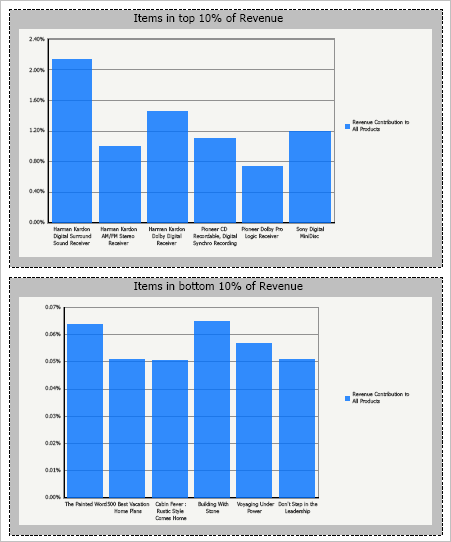
The report is used on the document shown below. Although the Revenue in Deciles metric is not displayed on the document, it is used in the view filters of the two graphs. The first graph displays only those items in the top 10% of revenue (the Revenue in Deciles metric is equal to one), while the second graph displays only those items in the bottom 10% of revenue (the Revenue in Deciles metric is equal to ten). You can see in the bottom graph that two of the items displayed in the report are shown on the graph (The Painted Word and 500 Best Vacation Home Plans). Only a portion of the document is displayed.

The image above shows a MicroStrategy document. Documents can display a report as a graph, a grid, or as both a grid and a graph in the same display. Documents can also display different parts of the same report in the same display, as shown in this example. For more information on using documents, see the Report Services Document and Dashboard Analysis Guide; for steps to create documents, see the Document Creation Help
