MicroStrategy ONE
About Subtotals
In the context of reports, subtotals reflect data rolled up to the selected attribute levels and can be applied dynamically to any report. You can apply subtotals using one of many standard subtotal functions such as total, count, minimum, maximum, standard deviation, and others. For a list of the standard subtotal functions, see Defining Subtotal Defaults. You can create a customized user-defined subtotal using the Subtotal Editor. For more information, see Defining Subtotal Defaults.
On a report, you can apply the subtotal by position, across a level, or using group by. This Applied levels option, which is located on the Advanced Subtotals dialog box, does not affect the location of the subtotal on the report, but rather how the subtotal is calculated. To change the display location, use the Display Options tab in the Subtotals dialog box; for steps, see the MicroStrategy Developer help.
- Applying a subtotal across a level calculates a subtotal across the selected attributes. The subtotal is applied to particular levels-rows, columns, and pages. This means "group by attributes to the left of the selected attribute."
If you have Region and Employee, in that order, on a report (as on the Basic Report), selecting across Employee means group by Region. A subtotal for each Region, totaling the individual Employee-Region values, displays on the report. Likewise, across Region means group by none since there is nothing to the left of it on the report. The result is a grand total. However, if the report is pivoted and the order of the attributes changes, the totals also change. If Employee is pivoted to the left of Region, the across Employee subtotal means group by none.
- The by position option means applying the subtotal based on its location on the report. The subtotal is calculated across all attributes and hierarchies on the report. It provides the same behavior as across level, but without selecting a level. Instead, the level is selected dynamically so these subtotals change as you alter the layout of the template. The two choices for by position are All subtotals, meaning "across all attributes," and Grand Total, meaning "across the leftmost attribute."
You can choose to subtotal on rows and/or columns. The Basic Report contains the columns Region, Employee, Revenue, Cost, and Profit. You can subtotal by both rows and columns, which provides totals at the employee and region level for each metric.
By default, the by position option is selected.
-
Group by applies the subtotal by the selected attribute across all other attributes on the template, regardless of position. Group by effectively allows you to use both subtotal and sort by attributes that are not the furthest to the left. The Grand Total check box allows you to also add a subtotal grouped by nothing, effectively calculating a total of all attributes on the template.
If a report contains Region, Category, and Quarter and you group by Region, a Region subtotal always appears, regardless of where Category and Quarter are located with respect to Region. You can also group by multiple attributes. Grouping by Region-Category on that report provides a subtotal every time a new Region-Category combination occurs.
Group by works best if the report is sorted by the same attribute used to group the subtotals, regardless of position.
Subtotals by Position Example
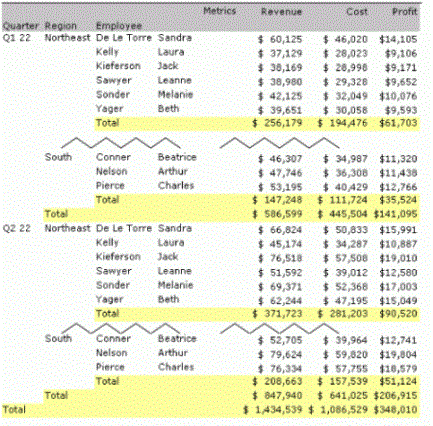
Open the Subtotals report, a sample of which is displayed below. This report is based on the Basic Report, with the addition of the attribute Quarter. Also, a view filter has been added, which includes only quarters 1 and 2 of Year 2022 and the Northeast, Central, and South regions.

You can create this report yourself by starting with the Basic Report. Note that the Subtotals report has a different format than the Basic Report. The Subtotals report uses the autostyle named SmallType, while Basic Report uses Squares.
Each region is totaled for each quarter, then each quarter is totaled, and finally a grand total is calculated. The subtotals use the by position option. To view how these subtotals are set up, select Subtotals from the Data menu.
Press F11 to show or hide the grand total display for reports in MicroStrategy Developer.
Move Region to the left of Quarter and notice that the subtotals change. Instead of totals by region, by quarter, and then a grand total, the subtotals are calculated by quarter, by region, and then for all attributes (a grand total). This dynamic recalculation is a feature of the subtotal by position option. Return Region to its position between Quarter and Employee.
Subtotals Across Levels Example
Begin with the Subtotals report, and change the by position subtotals to across levels.
To Set Subtotals Across Levels
- Choose Data > Subtotals.
- Click Advanced.
- Select Across level. A list of report objects appears.
- Select Region.
- Click OK, then OK again to return to the report.
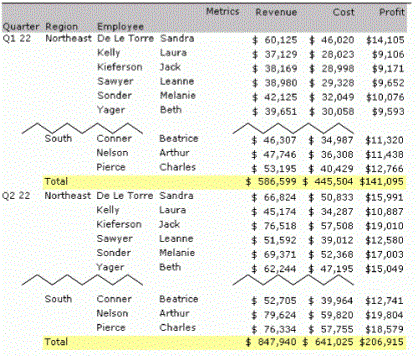
The only totals now are quarterly, as displayed below.

Across levels means group by attributes to the left of the selected attribute. Since the selected attribute is Region, the only attribute to the left of it is Quarter, hence the quarterly totals.
As you did with the by position example, move Region to the left. Only grand total is displayed, because now there is no attribute to the left of Region.
Return Region to its position between Quarter and Employee.
Subtotals Group by Example
Begin with the Subtotals report, which contains subtotals by position. Sort the report by region, by right-clicking Region in the grid and selecting Sort, then Ascending. Notice how the Q1 and Q2 Totals now appear at the bottom of the report.
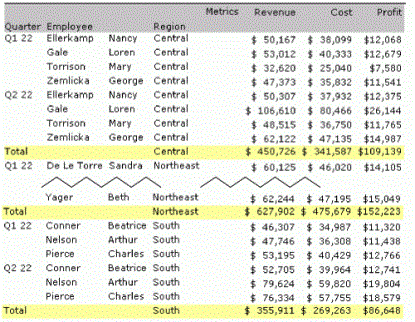
Move Region to the right, after Employee. The employees for each region are displayed, then employee totals for each quarter, with a quarterly total, and finally a grand total. Now change the by position subtotals to group by.
To Set Group by Subtotals
- Choose Data > Subtotals.
- Click Advanced.
- Select Group by. A blank list of group by levels appears.
- Click Add.
- Select Region from the list of attributes on the report.
- Click OK. Notice that Region has been added to the list of levels.
- Click OK, then OK again to return to the report.
Now the sort and the subtotals work together to provide regional totals, as shown below.

