Strategy ONE
Auto Adoption
Auto Adoption is only supported in MicroStrategy Cloud environments.
Starting in MicroStrategy ONE (June 2024), view user feedback information in the Auto Adoption Dashboard.
Starting in MicroStrategy ONE Update 12, Auto Adoption expands to include capturing agent usage. Platform Analytics can capture object (dashboard or agent) information such as object name, GUID, and modification time linked to every AI-related question submitted by a user.
Starting in MicroStrategy ONE Update 11, Administrators can use the Auto Telemetry for a high level understanding of the Artificial Intelligence (AI) features in the MicroStrategy Platform. The Auto Adoption telemetry is an extension of the Platform Analytics tool that captures the historical telemetry and answers core questions Administrators may have about Auto. Due to the near-real time capabilities, this feature empowers Administrators with the most recent transactional level statistics on questions submitted to Auto including timestamps for audit and troubleshooting.
Prerequisites
- Platform Analytics components are configured and running.
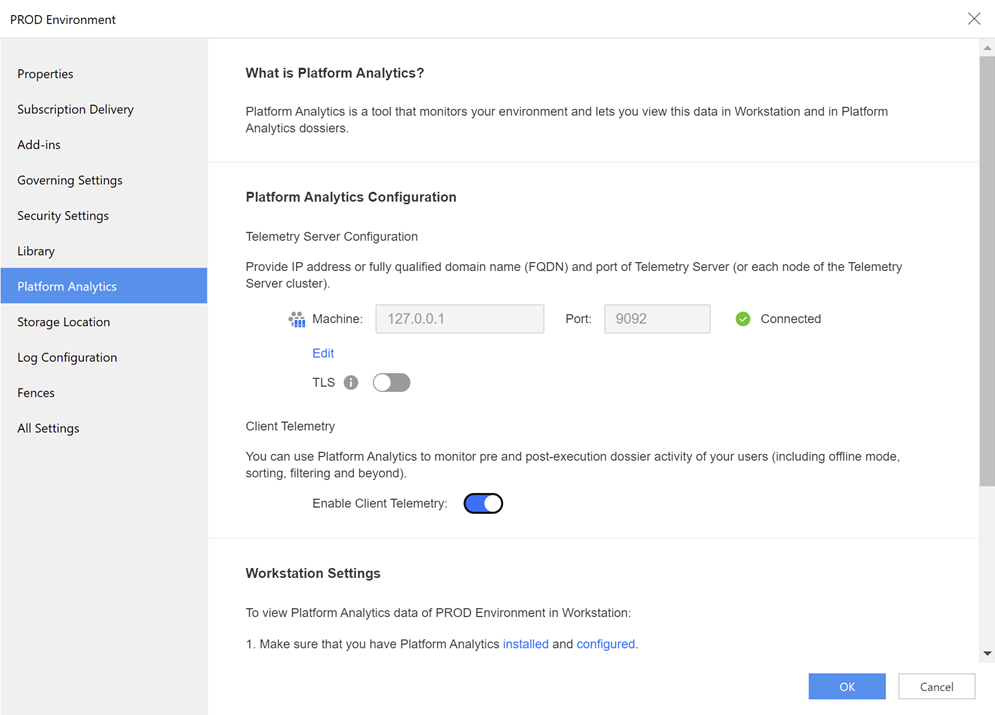
- In Workstation > Environments > Properties > Platform Analytics, ensure the status of the telemetry server is connected.
- You have access to the Platform Analytics project.
Capture Questions in Platform Analytics
Platform Analytics captures questions that meet any of the following circumstances:
- Questions are captured from Auto Answers, Auto Dashboard, and agents.
- User-typed question.
- Related suggestions question.
- There is no network interruption and the submitted question has reached the AI Service. The AI Service has then returned a response to MicroStrategy.
- The response from the Auto Service did not result in an error. For example, character limits, timeout, or network errors.
- Questions canceled by the user.
Review the Auto Adoption
To review adoption telemetry, Administrators can use the out-of-the-box telemetry dashboard or build custom content based on Project Schema objects.
Out-of-the-Box Dashboard
Starting in MicroStrategy ONE Update 12, the out-of-the-box telemetry dashboard is named "Auto Adoption" and is built on the Platform Analytics Project Schema objects using a live connect cube.
If you are using MicroStrategy ONE Update 11, the dashboard is named "Auto Assistant Adoption".
The dashboard has two chapters and starting in MicroStrategy ONE Update 12, an appendix with data definitions:
- Adoption Summary
- Filtered by the date range and feature.
- The data is refreshed every five minutes.
- The data is sourced from a high-performance aggregate day-level table.
Starting in MicroStrategy ONE Update 12, you can click Feature attribute elements to filter users or click user elements to filter objects.

Object information is only captured for Auto Answers and agents.
- Adoption Details
- Fixed to the last 30 days.
- The data is sourced from a transactional table with timestamps.
- Starting in MicroStrategy ONE (June 2024), use the attribute selector to filter different usage information.
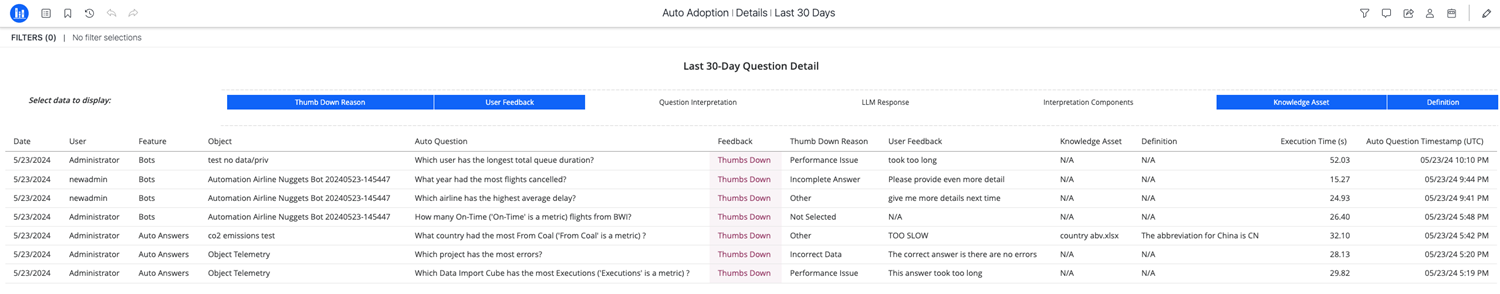
Object information is only captured for Auto Answers and agents. For Auto SQL and Auto Dashboard, the value is always "Not Applicable".
- Appendix includes definitions of each metric.
Build Custom Dashboard
Building a custom dashboard in Platform Analytics requires the same skill set as any other typical dashboard authoring.
See Auto Telemetry for a list of new schema objects.
Considerations
Telemetry configuration
Once the cloud instance is fully deployed, Platform Analytics services should be up and running, along with Auto Services and other services. No additional input is required from the Administrator.
If you disable statistics for all projects, Auto Telemetry will not be impacted, even if basic and advanced statistics are not configured. For more information on configuring basic and advanced statistics, see Enable Telemetry Logging for Intelligence Servers When Using Single Node Telemetry.
AI Enabled Users
AI Enabled Users are based on the most recent compliance check that is performed by the Intelligence Server whether it's scheduled or triggered manually.
Missing Data
Missing Data in the Auto Assistant Adoption dashboard is expected if you are not subscribed to the newest AI features and have not started using them.
Troubleshooting
There is no data or missing data in the out-of-the-box dashboard.
-
Check the items listed in Prerequisites and ensure Platform Analytics is set up correctly.
-
Ensure PA Consumer and dependent services are configured and running as expected.
-
Verify that clients send out data.
-
For Library Web, execute from Library and enable console mode from the browser (option + command + J).
-
Switch to the network and check Fetch/XHR and Payload for more details.
-
-
In a clustered environment, the clustered Library server may need to be restarted on both nodes to pick up configuration changes.
-
The Cloud clustered library file should be set similar to
/efs/saas_data/configOverride.properties on all nodes. -
On all nodes,
configOverride.propertiesin the Tomcat Library app must have matching information.Copyproducer.kafkaProperties.security.protocol = PLAINTEXT
producer.kafkaProperties.bootstrap.servers = node1IP_on_both_nodes:9092
-
Incorrect data appears in the out-of-the-box dashboard.
-
Check the PA Consumer log at
/PlatformAnalytics/log/platform-analytics-consumer-X.logand look for any errors or warnings. -
Review the Platform Analytics warehouse tables:
-
fact_ai_chatbot_interactionsThis table contains transaction-level data results. -
agg_fact_ai_chatbot_interactionsThis table contains aggregate-level data results.
-
-
Perform a Kafka topic check. It's typically saved in the messaging services folder at
/MessagingServices/Kafka/tmp/kafka-logs/Mstr.PlatformAnalytics.AIChatbotInteractions-0. Retrieve Kafka messages for theMstr.PlatformAnalytics.AIChatbotInteractionstopic:Copy{"ai_assistant":"4","user_id":"EFDCFC71459BFB3FB6ABCEB62A5E0C62","question_type":"2","question_id":"22EA5BB7902BCB22909980F32A161407","request_time":"1701288219954","response_time":"1701288231483","has_error":"0","message_id":"FF6195C6C54683262E89A2BA7D94D14B","object_id":"EB1A1F0D3144E4DAEA254895BC815B01","project_id":"320119840C4F018BA72C12852C8FB1F6","HASHED_REPO_CONN_STR":"CCF8618B33AEB752A70B865D860F639D5551972F13B8AF36E574AA7EB7371963E6D51BF6F85CAB33DAA43653EE89F1D0817842528C24CCE437397982605D6B8D","REPOSITORYID":"9CEDA4451544C5BF225EE8995D6B9D9C","CLIENT_SOURCE_DSS_TYPE":"0"} -
Perform a client request check:
-
Enable the console mode from the browser. Use the following keyboard short cut: Option + Command + J.
-
In the Headers tab, check the host information below Host.
-
In the Response tab, check the telemetry information.
-
If the dashboard with the Account attribute does not display the correct data result, the root cause may be that an initial load isn't triggered. Check an initial load process was initiated and completed. If issues continue, contact MicroStrategy Support. For more information on initial load, see Trigger the Initial Load of Object Telemetry.
-