Strategy ONE
Auto Dashboard: Dashboard Page Design
Strategy One (August 2025) introduces a preview feature, Auto Dashboard 2.0, which has been enhanced to improve responses and the design process. Beginning in Strategy One (September 2025), Auto Dashboard 2.0 is available out-of-the-box.
For more information on the enhancements, see Auto Dashboard 2.0 Enhancements.
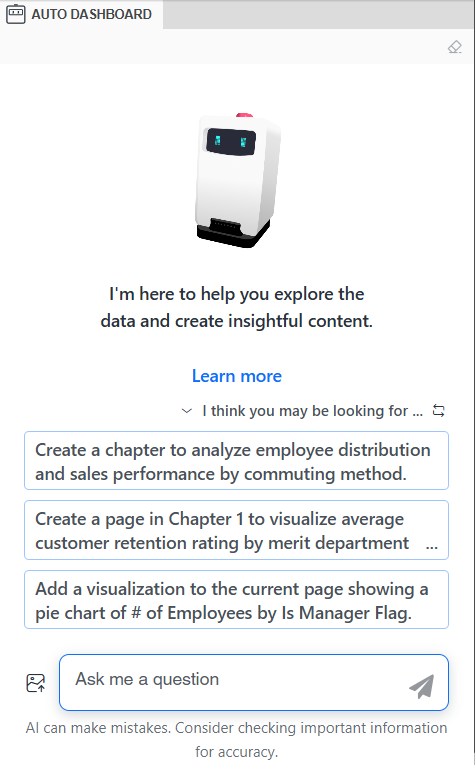
Leverage AI-powered dashboard page design with Auto Dashboard to streamline your analyses. Simply provide data and then ask Auto Dashboard to generate a visualization, dashboard page, or a chapter containing multiple pages. If you’re not sure how to start analyzing your data, use Auto Dashboard’s list of analysis suggestions. You can even regenerate the suggestions, making it a useful tool to easily see what analyses might be helpful for the dashboard's datasets.
Use Auto Dashboard to:
-
Streamline dashboard creation
-
Ensure visual consistency
-
For example, titles and borders display in dashboard palette colors
-
-
Improve the experience for your end users by quickly and automatically creating visually consistent dashboards that employ visualization best practices
-
Clarify system capabilities and limitations
Auto Dashboard can understand and respond in languages other than English, providing robust multi-language support for diverse linguistic users. For instance, page and visualization titles display in the user's locale.
For example, an analyst at a call center needs help creating a dashboard to understand various performance and satisfaction measures. After importing data into a new dashboard, they use Auto Dashboard to generate page recommendations. Because the analyst is most concerned with understanding customer satisfaction, they click the Customer Satisfaction by Service page suggestion. Auto Dashboard generates the page, which contains:
-
A key performance indicator (KPI) of overall customer satisfaction
-
A bar graph of customer satisfaction by employee
-
A grid of the top 10 customers with the highest satisfaction
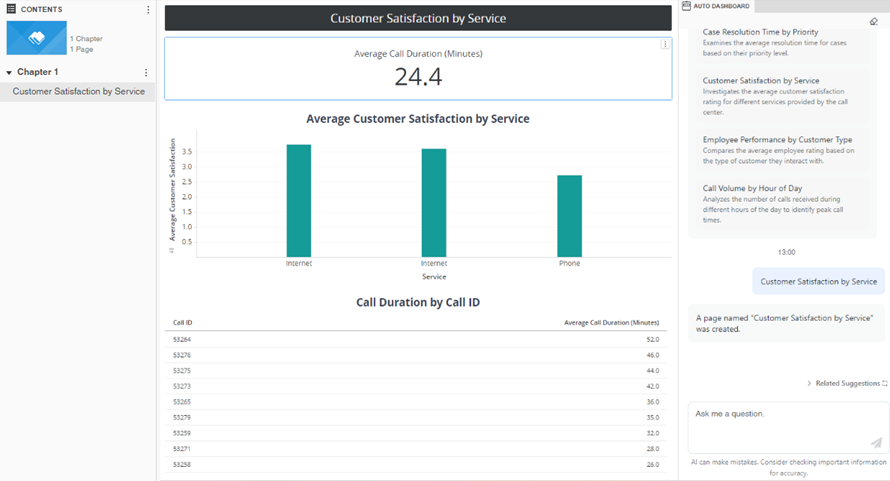
This is a great starting point for the analyst. After the page is generated, you can make manual changes to the dashboard or consult Auto Dashboard again for the perfect display. The analyst knows this page would be more helpful if it also visualized employee ratings. In the Auto Dashboard panel, they click the suggestion Show me a graph of Employee Rating by Customer. Auto generates the graph and a textual explanation and adds it to the page.
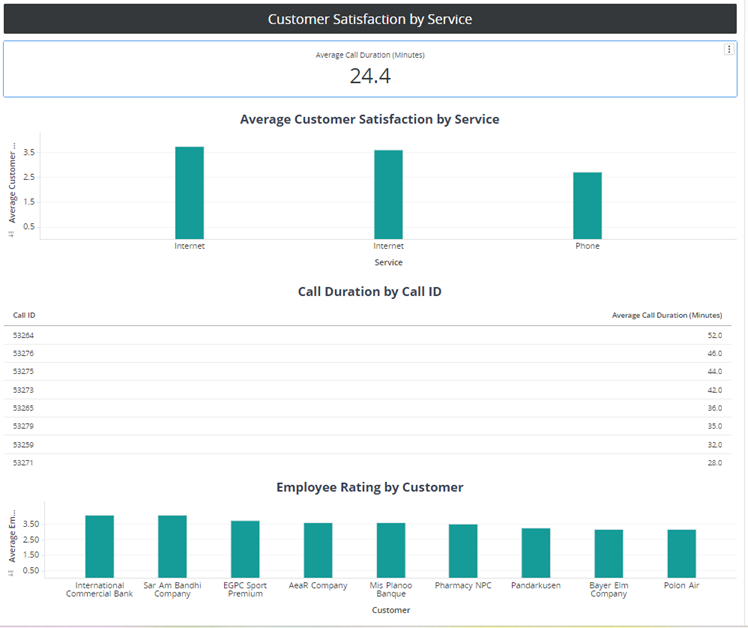
The analyst can now rearrange and edit the visualizations as needed, refining the page to meet specific user needs and design specifications. They can continue generating new visualizations and pages manually or by using Auto. Regardless of design and analysis experience, any user can efficiently create impactful dashboards that adhere to their organization’s standards.
Leveraging Different Datasets for Content Creation
If your dashboard contains multiple datasets, Auto Dashboard selects a single dataset when generating content. This ensures data integrity and prevents potential misinterpretations that can occur when datasets are merged or joined. The source dataset is determined by relevance to your input or the analysis recommendation that you select.
When you create a new page or visualization using Auto Dashboard, Auto reassesses the available datasets and selects the dataset that best answers the new query. Auto Dashboard’s analysis recommendations also adjust based on the available datasets and the potential logical relationships between the attributes and metrics in them. Therefore, different pages or visualizations within the same dashboard can be based on different datasets, but when you generate a page or visualization, only a single dataset is used.
Auto Dashboard 2.0 Enhancements
Strategy One (August 2025) Enhancements
Beginning in Strategy One (August 2025), Auto Dashboard has been enhanced to improve responses and streamline the dashboard design process.
-
Updated interface: The interface has been redesigned to match the look and feel of Agent 2.0, featuring a more intuitive conversational interface.
-
Automatic visualization display: Newly created visualizations now automatically appear in the dashboard page without requiring manual addition, saving you time during the design process.
-
Multi-page chapter support: Organize related content by automatically creating chapters containing multiple dashboard pages, enabling more complex and organized data storytelling.
These enhancements complement the existing AI-powered features while making the dashboard creation workflow more efficient and visually consistent.
Strategy One (September 2025) Enhancements
Starting in Strategy One (September 2025), Auto Dashboard introduces these significant improvements:
-
Image-based dashboard creation: Upload a picture of a dashboard and Auto Dashboard generates a similar one for you. The images can be:
-
Screenshots of existing dashboards
-
Hand-drawn sketches or wireframes
-
Conceptual dashboard designs
For detailed steps, see Create a Dashboard Page From an Image.
-
-
Enhanced color palette system: Experience more visually harmonious dashboards with:
-
Automatic color application to visualization titles and borders
-
Consistent use of palette colors across all dashboard elements
-
Improved visual hierarchy through intelligent color assignment
-
These enhancements build upon the August 2025 features to further automate dashboard creation while ensuring professional, cohesive visual design with minimal manual effort.
Related Topics
Use Auto Dashboard to: