MicroStrategy ONE

Use Auto Dashboard to Create Dashboard Pages with Visualizations

Auto Dashboard is supported in MicroStrategy Cloud Environments (MCE) and starting in MicroStrategy ONE (March 2024), Auto Dashboard is supported on the MicroStrategy Cloud for Government platform. You can only use Auto Dashboard in MicroStrategy Library.

Starting in MicroStrategy ONE Update 12, Auto Dashboard is only available in Library. This release also adds improved support for creating visualizations and pages.

Starting in MicroStrategy ONE Update 11, you can use Auto Dashboard to automatically create a dashboard page with visualizations based on your dataset. You can create a dashboard page using any locales and visualizations will generate following your locale setting.

You must have the Use Auto Assistant and ML Visualizations and Use Collaboration Services privileges.

  1. Create or open an existing dashboard.
  2. You must have a minimum of one dataset.

  3. Click the Auto Dashboard icon in the upper-right.
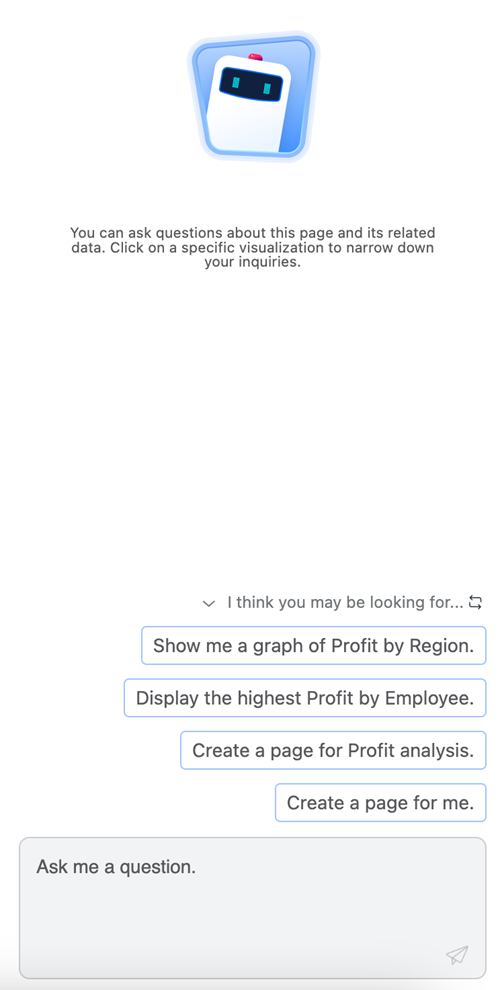
  4. Type a question or choose from the AI-generated list of content suggestions. Examples of questions depend on the attributes and metrics in your dataset.
  1. To create a page of visualizations:
    1. Type "Create a page.".
    2. Auto will ask for further information based on your dataset.
    3. Choose a suggestion or provide a detailed command. For example, “Create a page for sales analysis, focusing on time and region-based revenue and profit trends.”.

  2. To create a single visualization:
    1. Select a suggestion or pose a business question to create a single visualization as done in Auto Answers.

    2. The visualization is created in the Auto panel. To move the visualization, hover your mouse over the visualization and click the add to page icon.

    3. You can refine the generated visualization by providing follow-up instructions to Auto Dashboard. Supported interactions include:

      • Sort on grid or graph

      • Change the visualization type

      • Add, remove, or replace an object in the visualization drop zone

      • Change the visualization title

      • Enable subtotal

      • Create a derived metric

      • Create a view filter

  3. Edit content generated by Auto Dashboard as you would any other content.
  4. To generate more pages or content using Auto Dashboard, click the Auto Dashboard icon and enter a new query or select a new suggestion.
  5. Click Clear to clear the chat history and start a new chat.

Auto Dashboard Considerations

Auto Dashboard understands user input and object names in most languages. The dataset objects should have meaningful and human readable names.

Dashboard pages and content generated by the Auto Dashboard will have human readable titles according to your locale setting.

Related Topics

Auto Adoption