Strategy ONE
Time Series Forecasting Analysis
Time series forecasting analysis is supported in Managed Cloud Enterprise and starting in MicroStrategy ONE (March 2024), on the Managed Cloud Government platform. You can only use this feature in Strategy Library (web browser only) and Workstation when you connect to a Library server.
Starting in MicroStrategy ONE (June 2024), in Auto Answers, users can forecast multiple elements of an attribute, such as predicting sales totals for different employees
Use Auto Answers for Forecasting
To leverage the power of predictive insights within Auto Answers, enter your forecasting question using natural language. For example, "What's the projected sales for the next quarter?" Auto Answers provides you with accurate forecasts based on your query, its deep understanding of your dataset objects, and advanced machine learning algorithms. To include break by analysis, you can ask "What is the Forecast for Revenue over Data broken down by Category?".
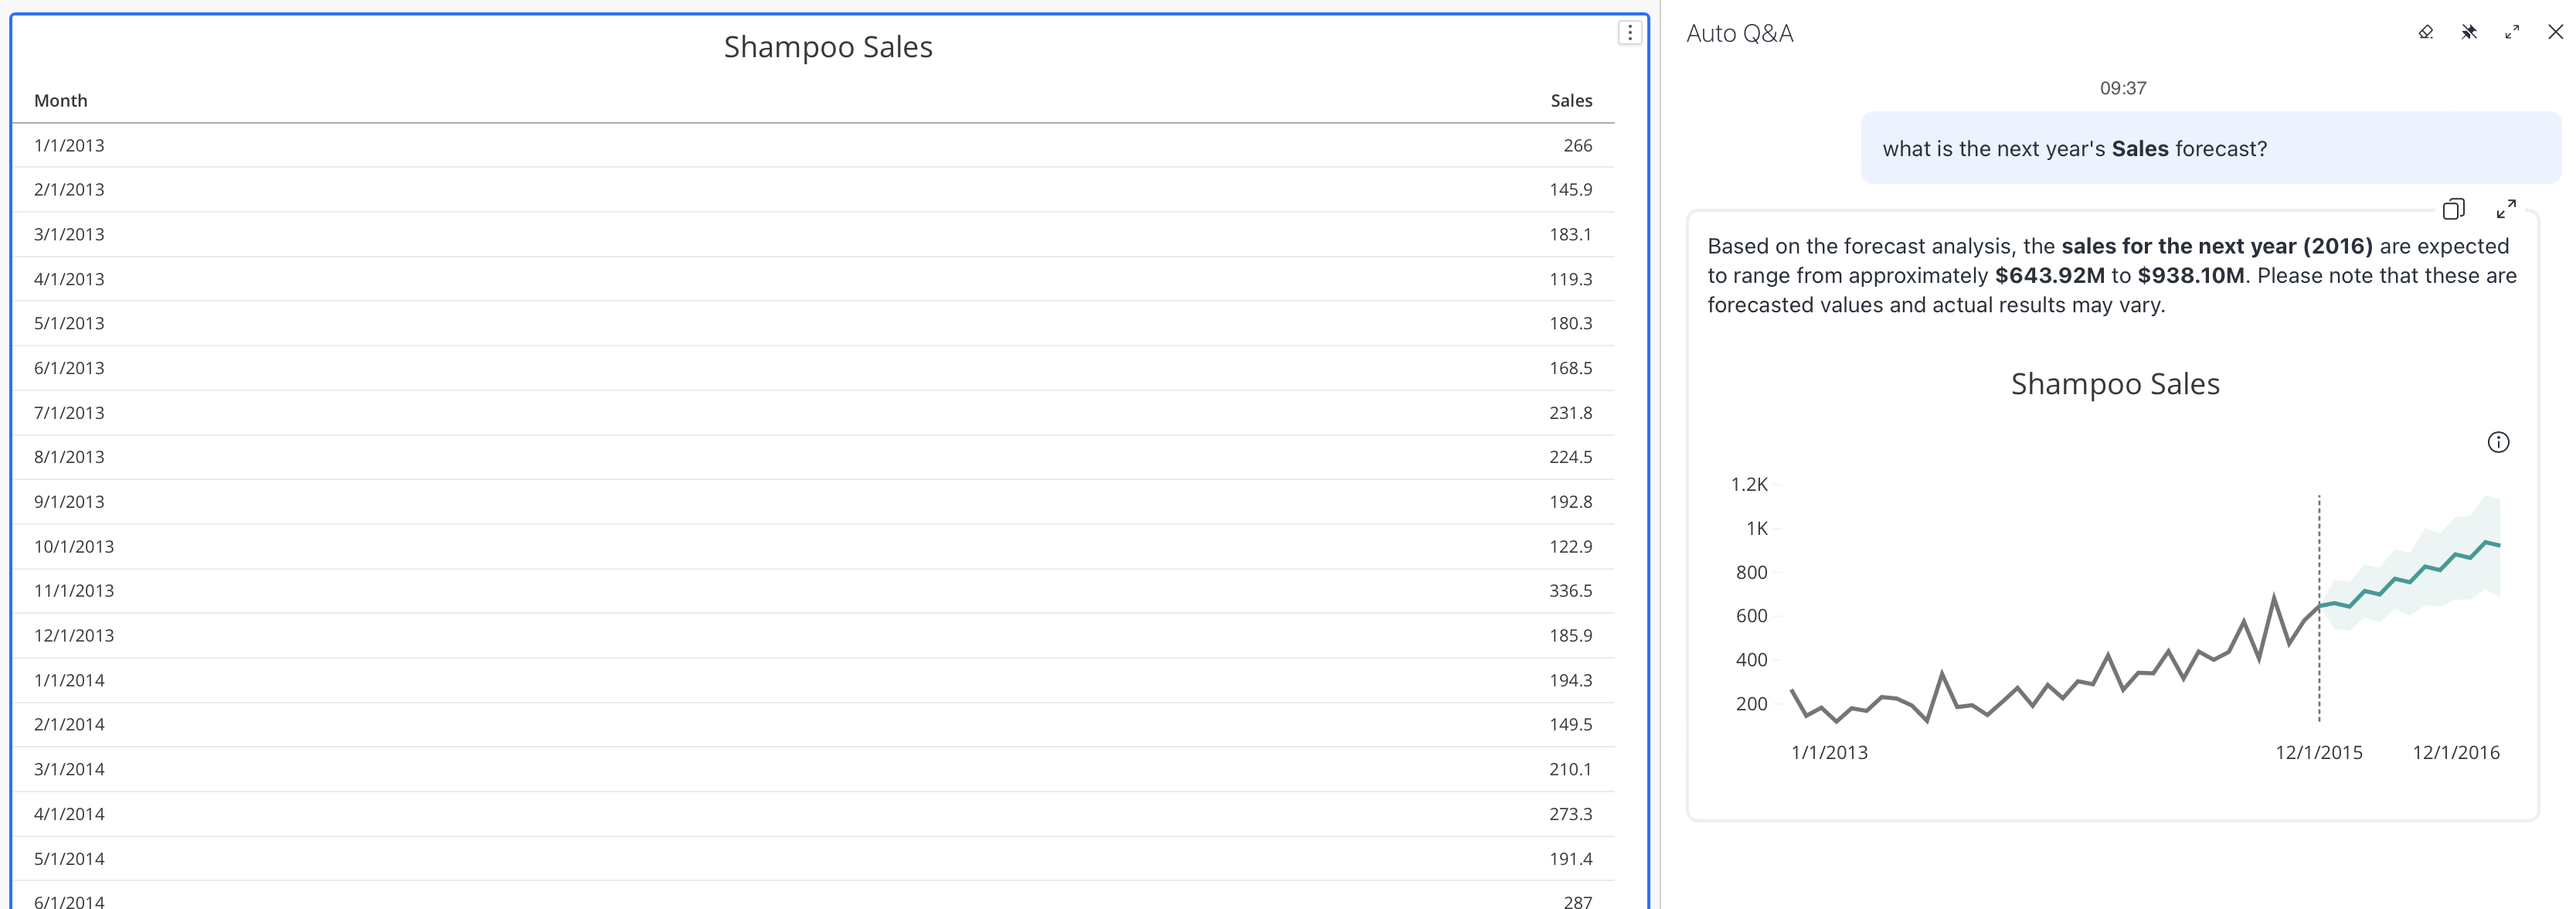
Auto Answers' response consists of a clear natural language description of the forecasted data with an accompanying forecast line chart visualization, making it easy to understand what lies ahead. While the visualization may contain a limited number of data points when rendered in the confined space of the chat panel, expanding the prompt’s response displays the entire set of existing and forecasted data points.
Here's how you can delve into predictions using Auto Answers
-
Next Few Months Prediction Start with a given monthly sales dataset. You can ask Auto Answers to forecast the sales for the next few months. The algorithm adeptly handles the task even if you're requesting predictions for an entire year based on monthly data.

-
Forecast at a higher level against lower level data Start with a given monthly sales dataset. You can ask Auto Answers to forecast the sales for the next year based on monthly data.
-
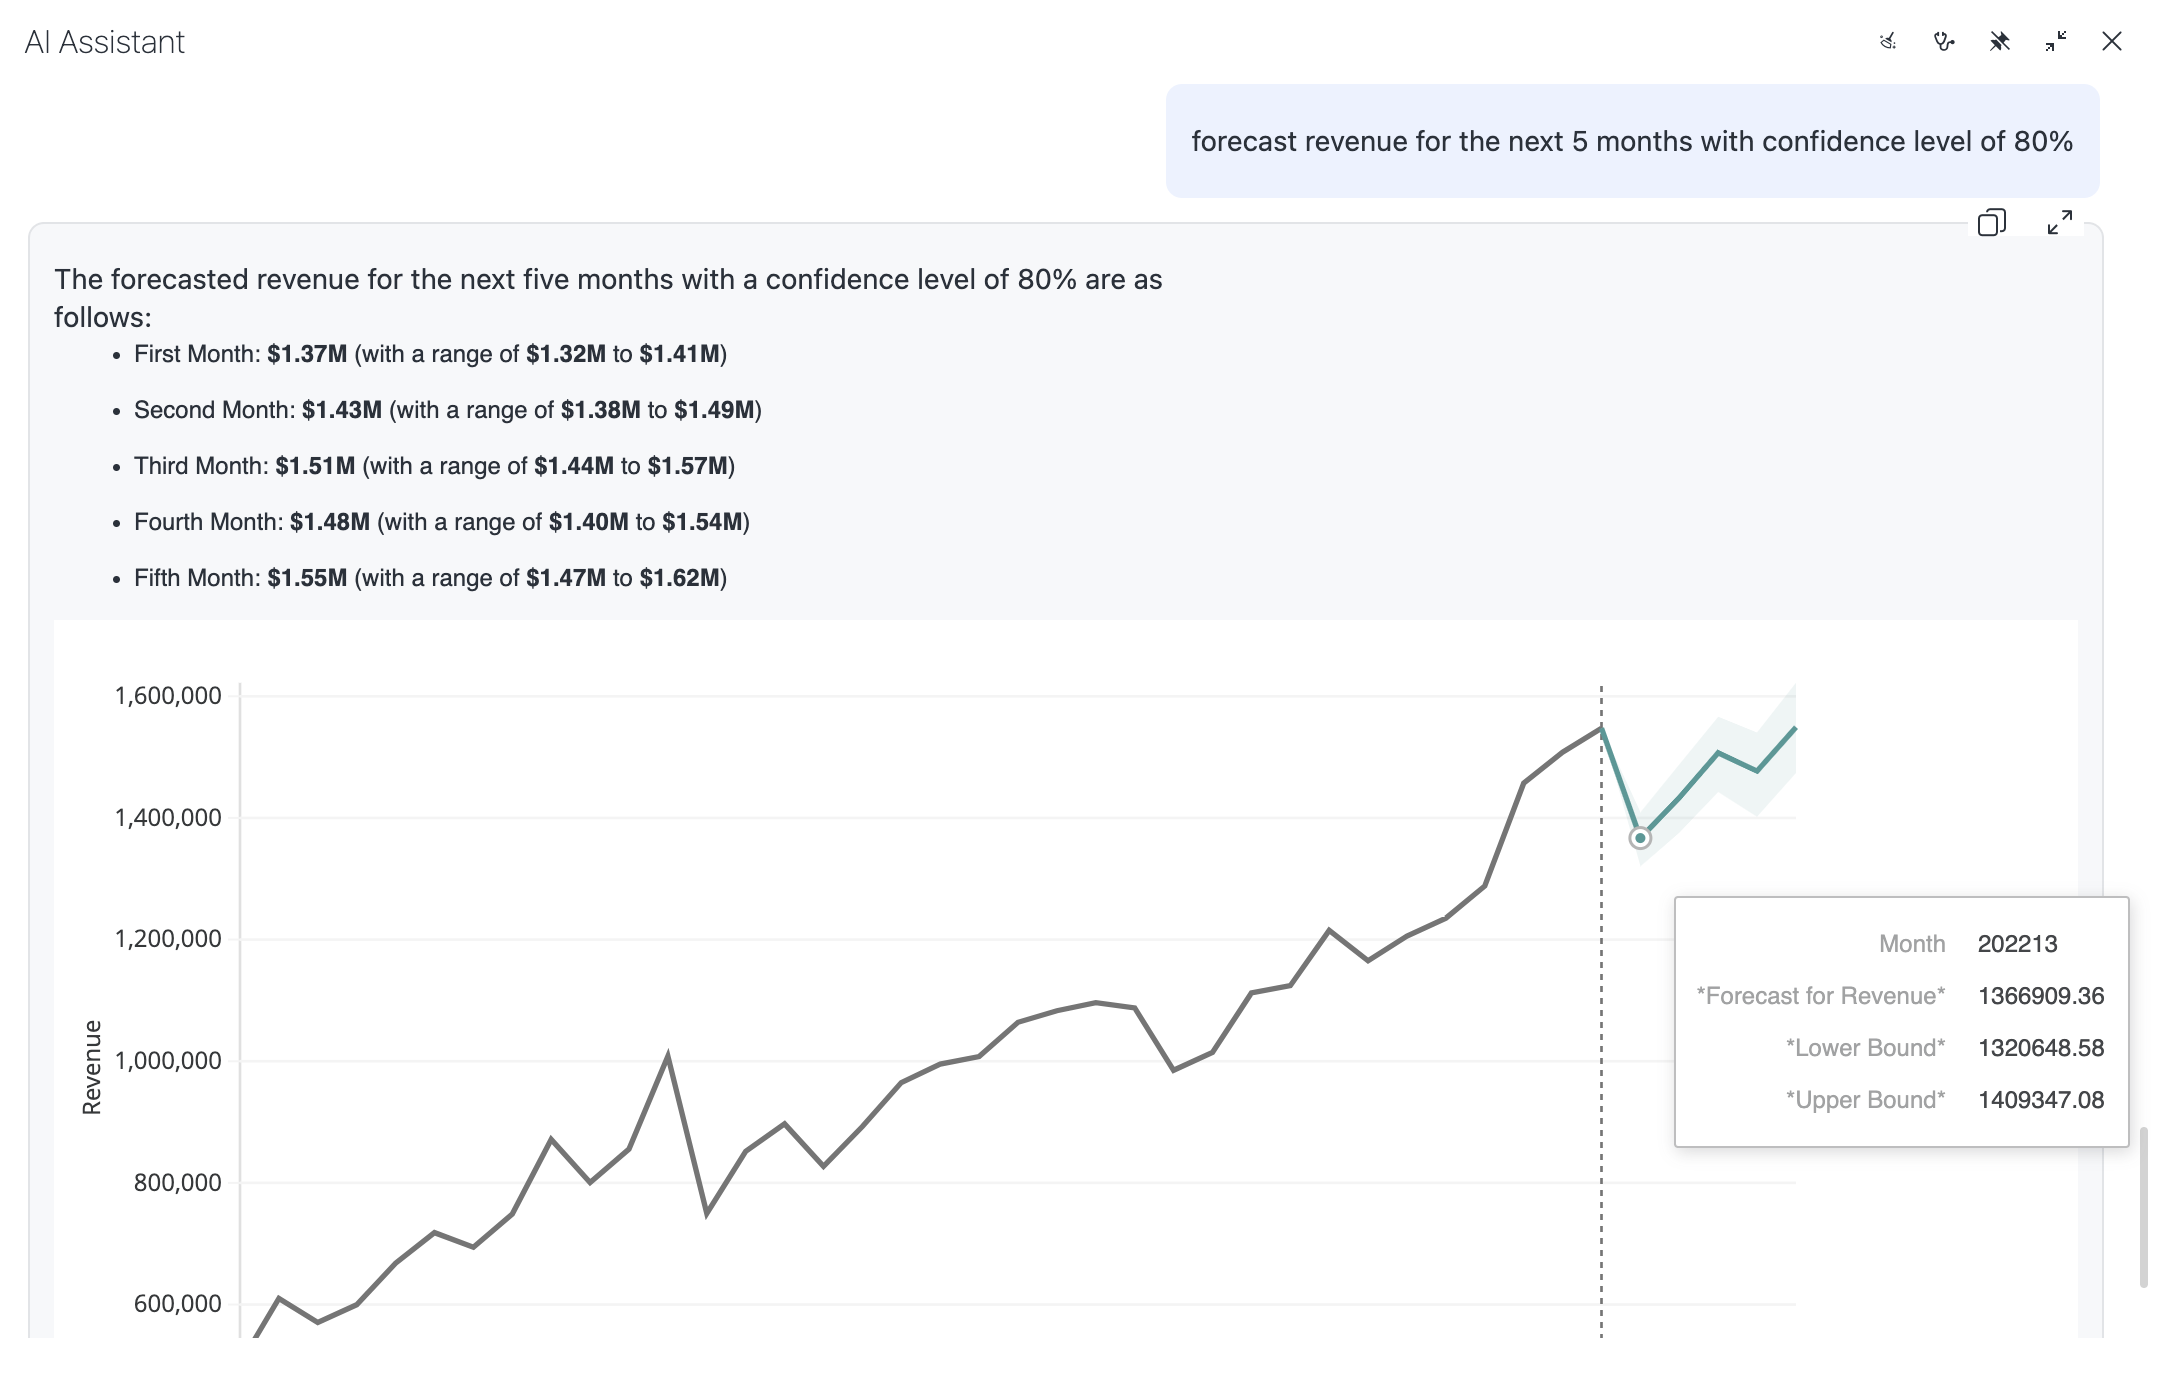
Hyper-parameters Tuning For those who want more control, there's an advanced option. You can adjust hyper-parameter values within your question. For instance, if the auto-detected seasonality doesn't yield optimal results, you can specify a seasonality length of your choice or set a specific confidence level. This flexibility extends to using different season and trend models, like toggling between multiplicative and additive models.
-
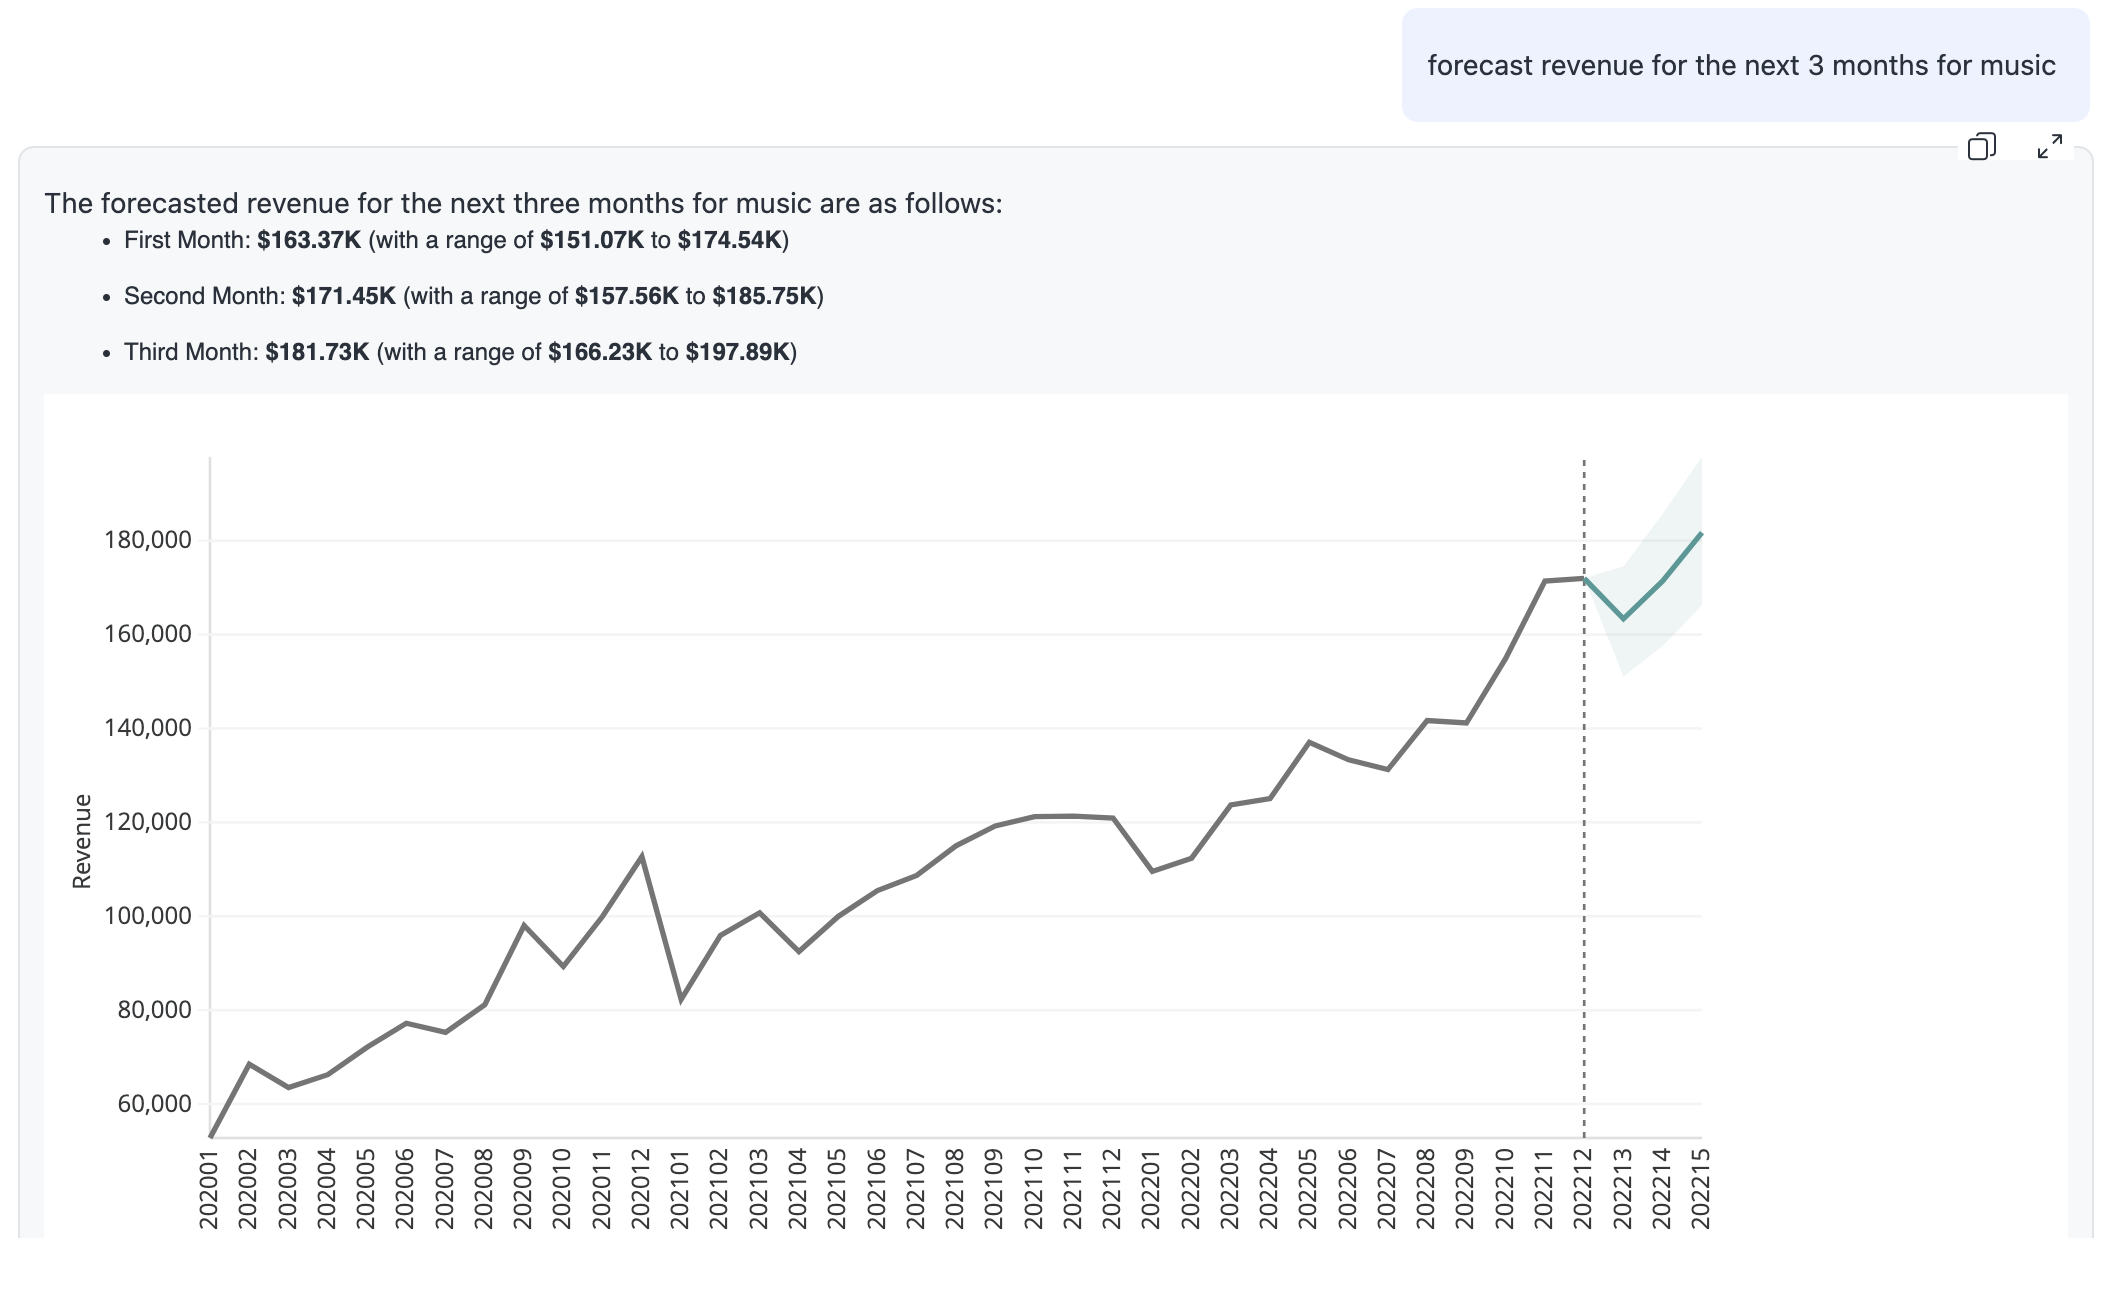
Applying Filters Predictions can also be filtered. The example below demonstrates forecasting for the next three months, considering a specific category such as music. Keep in mind that the month attribute is represented as an integer, not a time-based value.
-
Break By: You can get predictive insights about multiple data elements using questions such as "What is the Forecast for Revenue over [Date] for each product Category?".