MicroStrategy ONE

Key Driver Analysis

Single factor key driver analysis is supported in MicroStrategy Cloud environments and starting in MicroStrategy ONE (March 2024), single key driver analysis is supported on the MicroStrategy Cloud for Government platform. You can only use this feature in MicroStrategy Library (web browser only) and Workstation when you connect to a Library server.

MicroStrategy ONE Update 11 introduces key driver analysis. Single-factor key driver analysis empowers businesses to understand the dominant factors that influence specific outcomes. Key driver analysis drills down on individual variables to evaluate their impact and significance on a target metric. This targeted approach is particularly valuable to prioritize interventions and understand the core levers of performance.

By utilizing a blend of robust statistical methods, MicroStrategy's single factor key driver analysis tool provides users with a clear-cut and intuitive interface to discover the primary influences within their datasets. Whether you're a marketing manager, customer experience specialist, or supply chain analyst, this capability offers the clarity to focus on what matters, shape strategies around key drivers, and maximize returns on investments.

Using this diligent analytic method not only ensures precise insights, it also eliminates the clutter of multi-variate complexities, which makes the decision-making process more streamlined and effective.

Access Key Driver Analysis

Single factor key driver analysis is part of the MicroStrategy AI add-on bundle and is available for MicroStrategy Cloud Environment (MCE) customers starting in MicroStrategy ONE Update 11 (September 2023). Only users and user groups with the Use Auto Assistant and ML Visualizations privilege are able to access key driver analysis.

Key driver analysis is available in the following ways:

  • Through the visualization gallery in a dashboard using a drag and drop interface to create a Key Driver visualization.

  • Auto can utilize natural language queries to perform key driver analysis

Create a Single Factor Key Driver Visualization

  1. Open a dashboard for editing.

  2. In the top toolbar, click Visualization .

  3. Choose Insight+ > Key Driver.

  4. Drag a metric from the Datasets panel to Target in the Editor panel.

  5. Drag attributes from the Datasets panel to Potential Drivers in the Editor panel.

Use Attributes as Additional Explanatory Factors

Add attributes to More Data Levels field:

For attributes that might not be your primary focus, MicroStrategy recommends adding them to More Data Levels. The target metric is analyzed at the visualization level, meaning the possible factors are determined from the pool of Potential Drivers objects. However, this reduces the granularity for the underlying algorithm and increases the precision of the result. This feature is specific to Key Driver Analysis visualization.

Customize the Appearance of a Key Driver Visualization

Make your key drivers visually engaging by customizing the appearance of your Key Driver visualization. Adjust colors, fonts, and labels to match your preferences and create a chart that's not only insightful, but looks great!

By default, factors that cause a metric to increase use the first color from the chosen color palette and factors that decrease the metric use the second color from the chosen color palette. However, you can customize the color, factor labels, and text using the Format panel.

  1. In the Format panel, click Text and Form .

  2. Under Title, select a font, size, and color.

  3. Under Factor Labels, select a font, size, and color.

  4. Under Shape, select colors for increasing and decreasing the value of the analyzed object.

Use Auto Answers for Key Driver Analysis

To get started using Auto for key driver analysis, you must open Auto Answers in Library.

To harness the power of understanding pivotal influences on your business measures, ask Auto for factors that affect your metric. Simply input your query, like "What is the main driver for our sales growth?" Auto delves deep into your dataset, leveraging its intricate understanding of the data dynamics, combined with cutting-edge analytical algorithms.

The result? A straightforward, comprehensible breakdown of the primary factors influencing your specified metric, accompanied by an intuitive butterfly chart visualization to enhance clarity. In compact mode, you see the top three factors affecting your metric. By expanding the answer, you'll get a comprehensive look at all factors that contribute to the metric value, giving you a fuller picture and greater analytical depth.

Here's how you can delve into analysis using Auto. Auto is shown in expanded mode below.

  1. Drivers of your metric Start with a dataset containing multiple attributes and metrics. You can ask Auto to look for factors impacting the value of a specific metric. Ask the question, "What drives Revenue?"

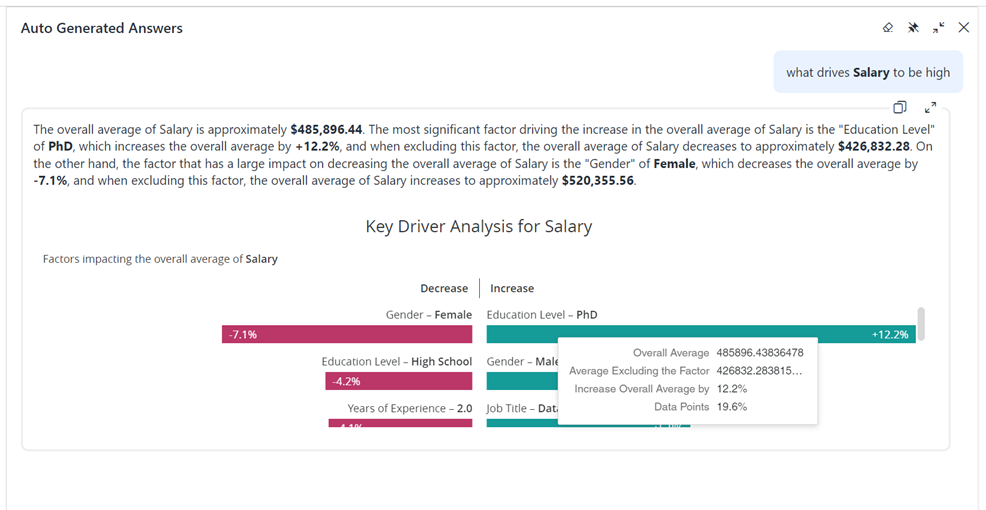
  2. What keeps a metric at the desired level Key driver questions can be asked with specific outcomes in mind. Auto can generate a text description of the data, specifying factors that drive a metric in the desired direction.

    Ask the question, "What drives Salary to be high?"

Optimize Key Driver Analysis Visualization Interpretation

Get the most out of your key driver line chart visualization.

Hover for Insights Hover your cursor over a data point in the Key Driver Analysis visualization to reveal a tooltip. It contains detailed information about key driver analysis values.

Tips and Best Practices

Tips for Key Driver Analysis Questions

  • Use Natural Language Auto understands conversational language. Frame your questions in a natural way, as if you were asking a colleague.

  • Include Relevant Attributes Include the necessary attributes and metrics in your question to ensure the Auto understands the context. If attributes are not specified, Auto runs the analysis for all attributes in the dataset.

  • Leverage the auto-complete feature For optimal key driver analysis using Auto, it's recommended to choose metrics and attributes from the auto-complete suggestions. This ensures precise understanding by Auto for accurate key driver analysis.

  • Avoid Ambiguity Keep your questions clear and unambiguous. Complex or convoluted queries might lead to inaccurate responses.

  • Expand for Clarity If you need to see more detailed information or display the entire set of data points, expand the visualization. This enhances the readability of the chart.

Best Practices When Using the Key Driver Analysis Visualization

Use High-Quality Data for Key Driver Analysis While MicroStrategy performs lightweight data processing before key driver analysis, such as eliminating some missing metric data, results can be compromised if there's a significant amount of missing metric data. For accurate key driver analysis results, it's important to ensure that your data is of good quality and substantial volume.

Limitations

The limitations listed below are associated with MicroStrategy ONE Update 11. MicroStrategy is actively working on enhancing the product and some of these limitations may be addressed in upcoming versions. For the latest information and updates, we encourage you to visit this page periodically. By understanding and considering these limitations, you can make the most of the key driver analysis feature and achieve meaningful insights.

  • Top factors In Auto Answers, only the top bottom three key factors can be shown in the summary text. We do not recommend explicitly asking for data outside of the range. Use expanded mode in Auto Answers to see the entire visualization and all factors impacting your metric.

  • Impact threshold Only the drivers whose impacts are greater than 2% appear in the visualization.

  • Numerical attributes Currently, we regard every value of a numerical attribute as a single potential drive. This may change in the future.

  • Data volume limits The data must contain at least eight rows. The maximum size of the data file is 40 MB.

  • Advisory The key driver analysis is designed to aid decision-making, but may not guarantee absolute accuracy. The insights offered should be used as a supplementary reference. It's essential to understand that correlation does not imply causation. Users are advised to exercise their own discretion and judgment when interpreting the results.

FAQs

What key driver analysis method is used?

MicroStrategy produces the key factors by calculating the impact value on the average value. The formula of impact value is:

Copy
Impact = (Overall Average Value - Average Value Excluding the Element) / ABS(Overall Average Value)

The impact value can reflect how the key driver influences the overall average. For example, you have a Data Scientist Salary dataset and the Employee Location is US has a 50% impact. This means the job location of a data scientist in the United States increases the overall average salary worldwide by 54%.

Can hyper-parameters be adjusted for key driver analysis?

Currently, MicroStrategy does not expose the hyper-parameter.