Strategy One
Use a Visualization to Filter Data in a Different Dashboard
Starting in Strategy One (February 2026), you can define contextual links on objects in visualizations and in the dashboard's datasets. Instead of displaying the link on the entire visualization, these object links allow you to control where a contextual link is available.
Starting in MicroStrategy ONE (September 2024), you can link visualizations to dashboards in a different project.
Use contextual linking to navigate from a source dashboard to a target dashboard, filtering data in the target based on the context of the source. This enables users to continue analysis across dashboards without reselecting prompts or filters.
You can use a visualization in one dashboard to link to and filter data in a different dashboard. First, a visualization is defined as the source. Then, a contextual link is defined to target the selected page from a different dashboard. You can filter the visualizations in the target dashboard page by:
-
The specific data point selected in the source (available starting in MicroStrategy ONE Update 11; before this, contextual links always passed the data point to the target)
-
The filter selections that the user makes in the Filter panel
-
The filter selections that the user makes in individual visualization (in canvas) filters
You can choose any combination of these options or pass nothing at all, which opens the target without any filtering from the source.
This dashboard page contains a filter on airline names, which targets the two grids, Month and Day. Comair and Delta are selected in the filter. When you right-click January in the Month grid, you can link to the Flight Analysis dashboard, unfiltered, as described in the tooltip. The link does not pass the visualization filter selections to the other dashboard.

When you click the link, the by Airline page in the Flight Analysis dashboard opens. All airlines are selected in the Choose Airlines filter, so they all display in the grid. The link passed the selected month, January, as indicated by the grid's filter summary.

When you right-click Sunday in the Day grid, you can link to the Flight Analysis dashboard, filtered, as described in the tooltip. This link does pass the visualization filter selections.

When you click the link, the same by Airline page in the Flight Analysis dashboard opens. Only Comair and Delta are selected in the filter, so the grid displays only those two rows. The link passed the selected day, Sunday, as indicated by the grid's filter summary, as well as the filter selections.

Starting in Strategy One (August 2025), you can filter additional pages in the target dashboard, not just the one initially opened in the link. The target page displays when you use the link, but the selected pages are also filtered. This helps pass the filter context to other pages.
The target dashboard in the example above contains two pages.
When you create the link, you select the target page to open; in the example above, that is by Airline. Other pages in the target dashboard are not filtered. For example, the target dashboard contains a second page, by Airport. When you use the filtered link from the Day grid, and switch to the by Airport page, its grid is not filtered.

If you edit the contextual link to pass the filters to the by Airport page, the grid is filtered by the data point (Sunday) selected in the source grid. This page does not have a visualization filter, so the airlines are not passed.

Starting in Strategy One (February 2026), you can define contextual links on objects in visualizations and in the dashboard's datasets.
You can trigger the link from anywhere in the visualization. For example, you can click a Revenue value and open the target dashboard.

While the target will still be filtered for the selected account executive (if selections filter the target's visualizations), you think limiting the link to the Account Executive will make the filter more intuitive for users. To control where a contextual link is available, define the link to use a specific object on the visualization. In the sample grid below, the link is only triggered by the Account Executive.

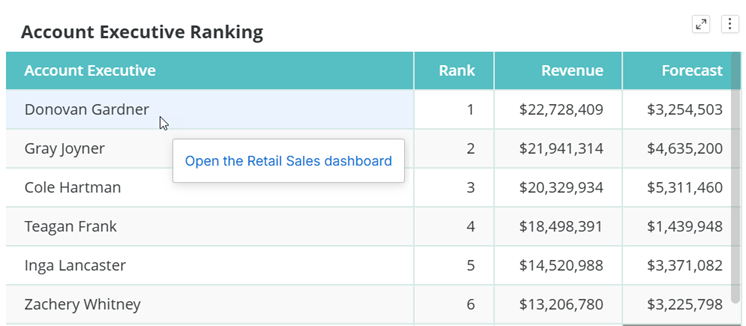
This version of the Account Executive Ranking grid links to the Retail Sales Report dashboard using the Account attribute, which is not included on the visualization itself. When you drill from Account Executive to Account, the default link displays in the right-click menu, as shown below:

If you added a custom tooltip, it displays after the drill and when you hover over an account, as shown below:

Review KB483883: Limitations of using a visualization to filter data in a different dashboard for detailed information.
Create a Contextual Link on a Visualization to Filter Data in a Different Dashboard
- Open the dashboard you want to modify.
- Hover over the visualization to use as the source, click More
 in the top right corner and choose Create Contextual Link.
- If the option displays as Edit Contextual Link, the visualization already contains a contextual link. Click it to continue.
- If the visualization already targets visualizations in the same dashboard, a message displays. The visualization cannot be a source for both target visualizations and contextual links. To remove the target visualizations, click Continue. To keep the target visualizations instead of creating a contextual link, click Cancel.
-
Starting in Strategy One (February 2026), in the Enable Link For drop-down list, select one of the following:
-
To trigger the link from the entire visualization, select Visualization.
-
To trigger the link from specific objects, select Objects.
-
To use objects on the selected visualization, click Current and select the check boxes for the object or objects to use as the source. The contextual link displays when the user hovers over the source object.

-
To use objects from the dashboard's datasets, click Datasets and select the check boxes for the object or objects to use as the source. The contextual link becomes available when the source object is later added to the selected visualization. For example, this can occur when a user drills to the source object or chooses it from an object selector targeting the source visualization.

-
-
-
In the Contextual Link dialog box, click the folder icon
 .
. 
- Choose a dashboard in the same project or, starting in MicroStrategy ONE (September 2024), browse a different project and choose a dashboard.
- Click OK.
- From the Page drop-down list, choose a page of the dashboard to target. All visualizations in the target page are filtered according to the Filter options you define below.
- In Tooltip, type a description for your tooltip. The tooltip displays when you hover over the source visualization and links to the target page.
- If you do not want to display the link in the tooltip, do not type anything into the Tooltip box. Users access the link by right-clicking an object in the source visualization. The default text for the link includes the target dashboard. For example, it displays as Go to Dashboard: Target Name.
- If you selected objects as the source, it is recommended that you add a tooltip. When users hover the visualization object or drill to the dataset object used as the source, the tooltip displays as an indicator that the link is available.
- Select whether to Open in new tab. The target opens in a new window Strategy Web and Library.
These Filter options are not mutually exclusive. You can select and clear any combination of them, including clearing all the check boxes, which means that nothing is passed to the target.
- To pass the filter panel conditions to the target page, select Pass the filter panel selections to the chapter of the target page.
-
To pass the visualization (in-canvas) filter conditions to the target page, select Pass selections in all visualization filters to the target page.
The attributes and metrics used in the Filter panel for both the source and target dashboards must be the same or match by filter name. See KB483883: Limitations of using a visualization to filter data in a different dashboard for more information.
- To pass the selected data in the source visualizations to filter the target page, select Use selections to filter target page's visualizations.
This option is available starting in MicroStrategy ONE Update 11.
Complete the Contextual Link
- The target dashboard opens on the page selected in the Page drop-down list. That page is filtered according to the Filter options you selected above. Starting in Strategy One (August 2025), you can filter additional pages in the target dashboard, not just the one initially selected. From the Pass selected filters to following pages of target dashboard drop-down list, select the check boxes for any additional pages to filter.
- You can select a chapter to filter all its pages. Any pages added to this chapter in the target dashboard after you create the link will be filtered.
- To filter all the pages in the dashboard, select All. Any pages added to the target dashboard after you create the link will be filtered.
- If all of the Filter options are cleared, this list is unavailable, since no filter conditions are passed.
-
If the target dashboard contains prompts, the prompts are listed. For steps to select how to answer each prompt, see Define How to Answer Each Prompt.
- Click Save.
- Save the dashboard.
Test the Link
- Hover over the object in the visualization to filter the target (such as a region or metric value). You know that the visualization is linked because the link icon
 displays in the upper left corner.
(For non-grid visualizations that use objects as the source, the link icon does not display.)
displays in the upper left corner.
(For non-grid visualizations that use objects as the source, the link icon does not display.)- If the cursor turns into a hand pointer, click the object to open the target dashboard page.
- If a tooltip displays with the link, click the object and then click the link.
- If it does not, right-click the object and then click the link.
The target page displays filtered according to the filter selections you defined.
- To remove the visualization filter from a visualization in the target dashboard, hover over the visualization in the target dashboard and in the top left corner, click Clear Filter
 .
.
In the following image, the contextual link was created to the Overview page of the Financial Analysis dashboard. In the list of pages, that page is selected and unavailable for change. The entire Analysis chapter is now selected, so all its pages are filtered when the link is executed.

Remove a Contextual Link
- Open the dashboard you want to modify.
- Hover over the visualization used as the source, click More in the top right corner and choose Edit Contextual Link.
- Click Remove Link. The link is removed and you are returned to the dashboard.