Strategy One
Create an Iconic KPI Visualization
Starting in Strategy One (November 2025), the enhanced KPI is shipped out of the box and renamed Iconic KPI.
Starting in Strategy One (September 2025), you can create an enhanced KPI visualization. This enhanced version of a KPI visualization allows you to upload your own image onto the KPI to further customize your dashboards for your business. You must enable the preview feature using the following steps.
Preview features are early versions of features and are not to be used in a production environment as the core behavior remain subject to change between preview and GA. By selecting to expose preview features, you can access and use them as you would any other functionality. The official versions of preview features are included in subsequent releases.
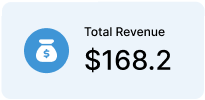
This is an example of iconic KPI for Total Revenue. The image used is a bag of money.
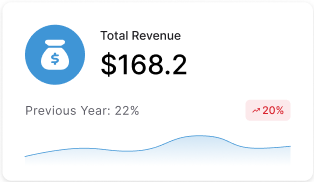
This is an example of the same iconic KPI with a yearly trend.
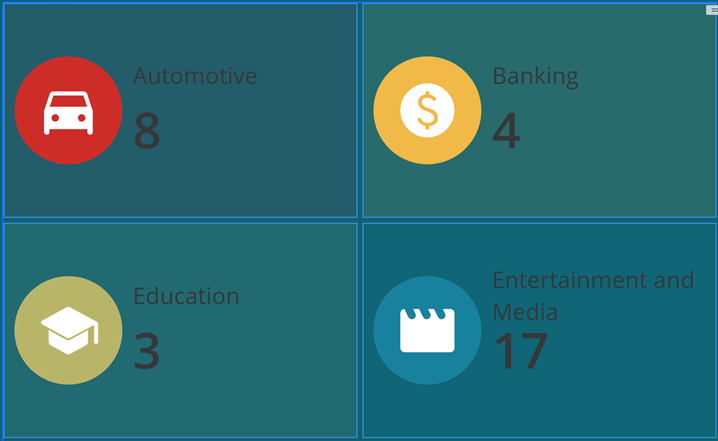
An iconic KPI can display multiple cards, one for each metric or attribute element on the KPI. In the example below, the same metric (number of accounts) breaks by the Industry attribute. Each attribute element (Banking, Education, and so on) displays as a separate card in the same KPI.
How the Icons Are Selected
If semantic search is enabled in your environment, the KPI employs semantic search to select an icon based on the break-by items or the metric names. Semantic search primarily matches icon names and labels; it does not involve AI-driven reasoning. For commonly-used metric such as Revenue and Profit, semantic search generally produces better results because of the clear and descriptive metric names. However, if the metric name includes abbreviates such as MA or NH, the results tend be less accurate because these terms provide limited semantic context and are more ambiguous.
If semantic search is not available, the system selects a default icon.
Enable the Enhanced KPI
Complete these steps to enable the preview feature.
-
Open the configOverride.properties file in the following location:
..\MicroStrategyLibrary\WEB-INF\classes\config\configOverride.properties. -
Add the following line:
features.supportEnhancedKPI=true. -
Save the file and restart Tomcat.
Create an Iconic KPI Visualization
-
Open a dashboard.
-
In the top toolbar, click Visualization
 .
. -
Choose KPI then click Iconic KPI
 .
. As a preview feature, this KPI is named Enhanced KPI .
-
In the Datasets panel, double-click metrics to add them to the visualization. A KPI visualization requires at least one metric.
An image is automatically assigned to each card in the visualization, although you can change them when you format the KPI.
-
To break the KPI into multiple KPI cards, drag an attribute to the Break By drop zone or add multiple metrics to the Metric drop zone.
-
To display trends for the metrics to help you quickly understand how these metric values have changed over time or another attribute, drag the attribute to the Trend drop zone.