Strategy ONE
Ask Questions to the Visualization
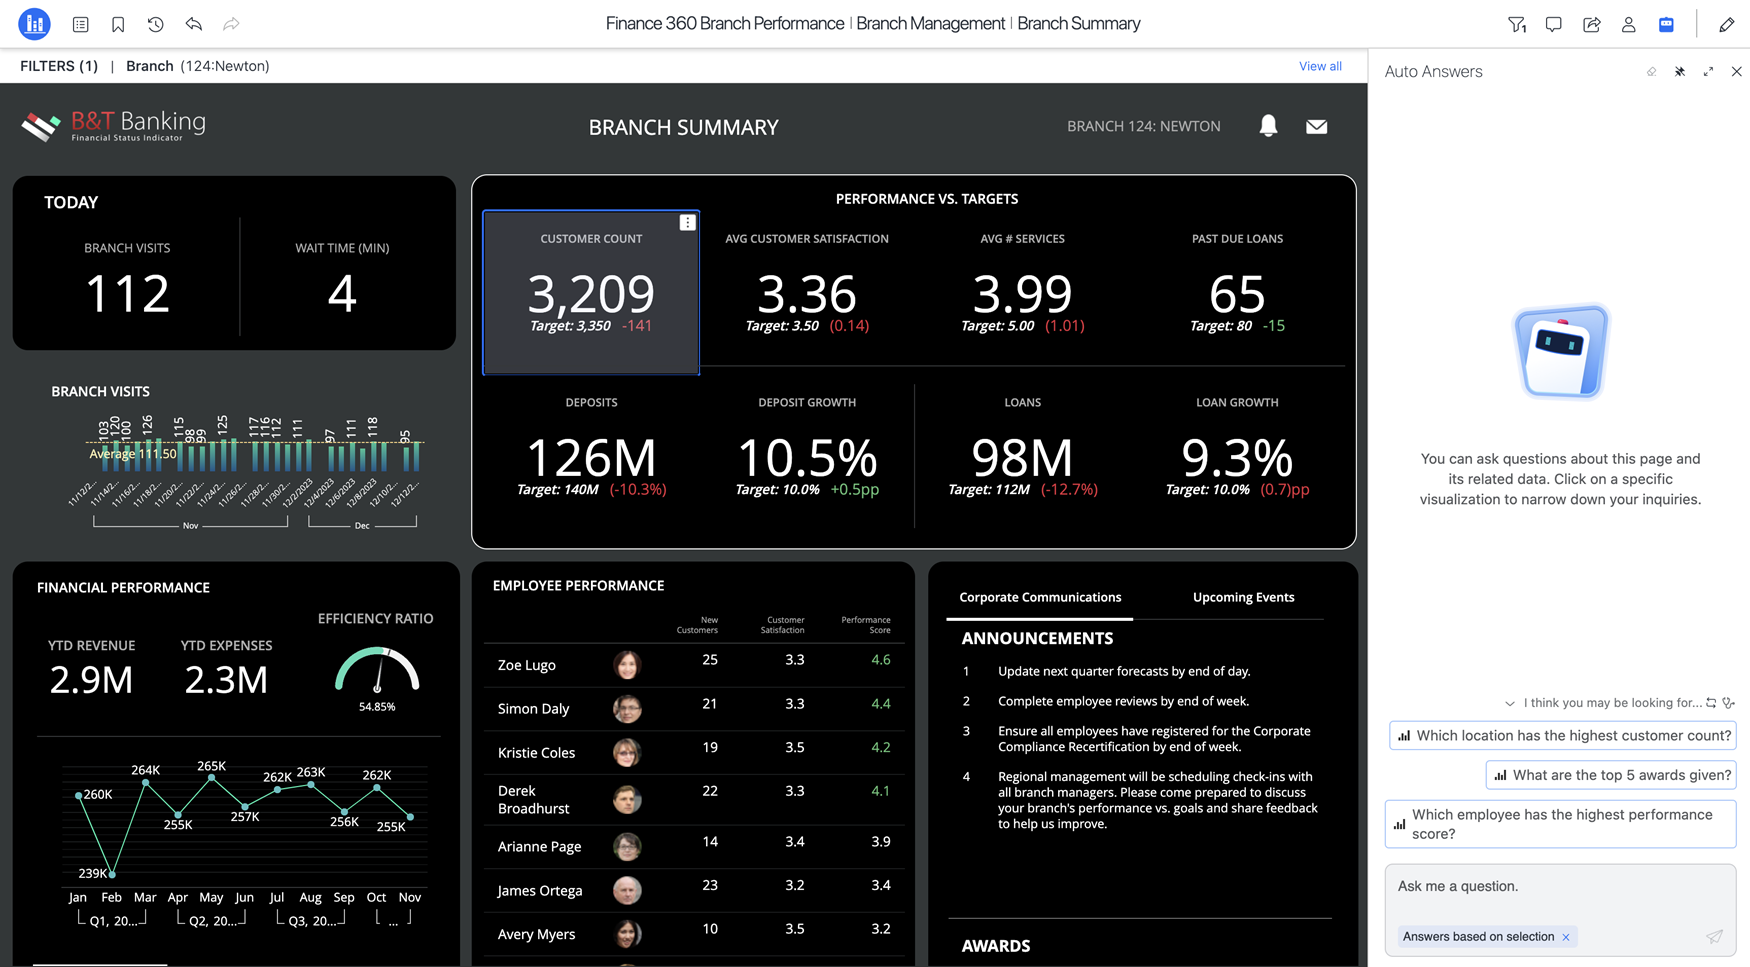
Use Auto Answers
-
Open Strategy Library.
-
Create a new dashboard or open an existing dashboard.
-
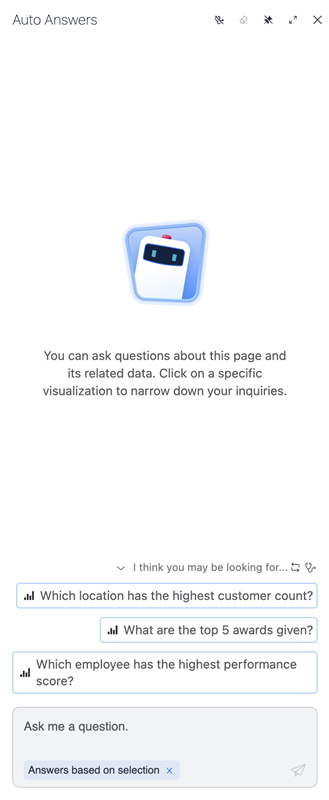
Click the Auto Answers icon in the upper-right.

-
By default, answers are based on the information displayed on the dashboard page. To narrow your results, click a visualization, then ask your question. When you click on a visualization before you ask a question, Auto Answers responses are derived based on the visualization's filter.
-
Starting in MicroStrategy ONE (March 2024), if selected visualization is influenced by an in-canvas selector, Auto Answers response incorporates the selector criteria and filters the results based on your selection.
-
If you ask about data that is not present in the chosen visualization, the answers may be misleading. In such instances, Strategy recommends that you remove the visualization from the chat context for more accurate answers.
-
Questions are limited to a 1000 characters.
-
By default, answers are based on the information displayed on the Dashboard page. For more details see Ask Questions to the Page.
-
-
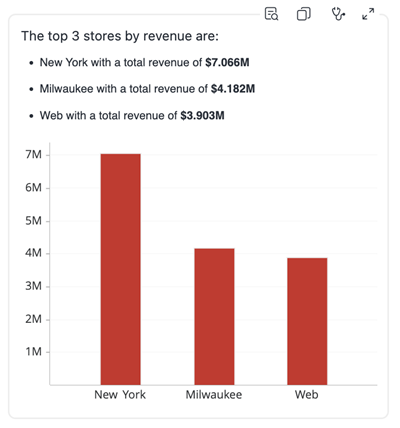
Once Auto Answers responds, you can click the relevant icon to maximize the visualization to full screen or copy the response to your clipboard.
-
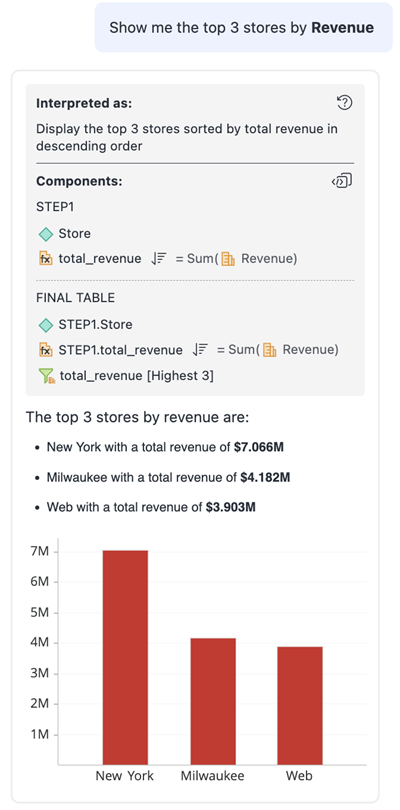
Starting in MicroStrategy ONE (March 2024), click the Interpretation icon for insights on how Auto Answers interpreted and executed your question. The extent of information that displays in the Interpretation window varies on your user privileges.
-
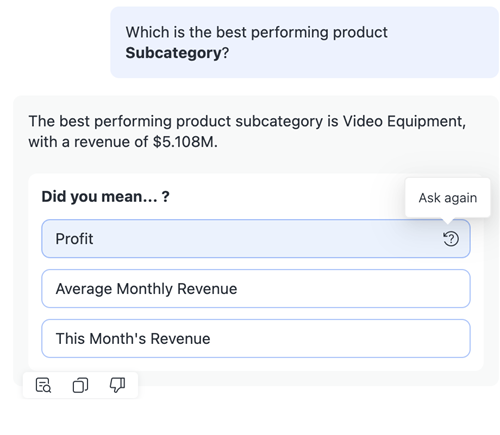
Starting in MicroStrategy ONE (June 2024), Auto Answers provides smart suggestions if a question is ambiguous. Choose a suggestion or click Ask Again to edit the suggestion.
See Use Suggestions for more information.
-
Starting in MicroStrategy ONE (June 2024), hover over a message and click the thumbs-down icon to provide feedback on the answer. You can add a comment or choose a predefined option such as Incomplete answer or Incorrect format. Auto Answers then evaluates the feedback to learn and improve.
Answer Compound, Multi-faceted Questions
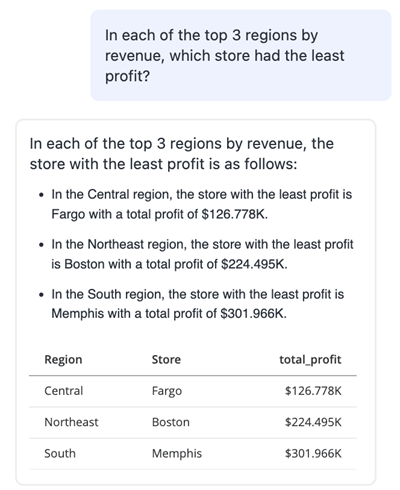
Starting in MicroStrategy ONE (March 2024), you can receive effective responses to compound, multi-faceted questions that span across multiple datasets in a dashboard. For example, you can ask "In each of the top 3 regions by revenue, which store had the least profit?". This update allows deeper, contextually rich insights drawn from multiple data points within the same question. In the previous example, Auto Answers computes the three regions with the highest revenue growth, then identifies the individual store with the lowest profit in each of the regions. Auto Answers then combines the responses from previous steps to display the final response.
Consider the question "Which 2 categories had the highest Profit growth between Q1 and Q2 2019?". This question unfolds in multiple layers. Initially, Auto Answers pinpoints all categories' profit for both quarters then it calculates the growth rates, and finally, ranks them to identify the top two categories. This methodology is better understood for every question when you expand the Interpretation window, where the multi-step execution is explained.
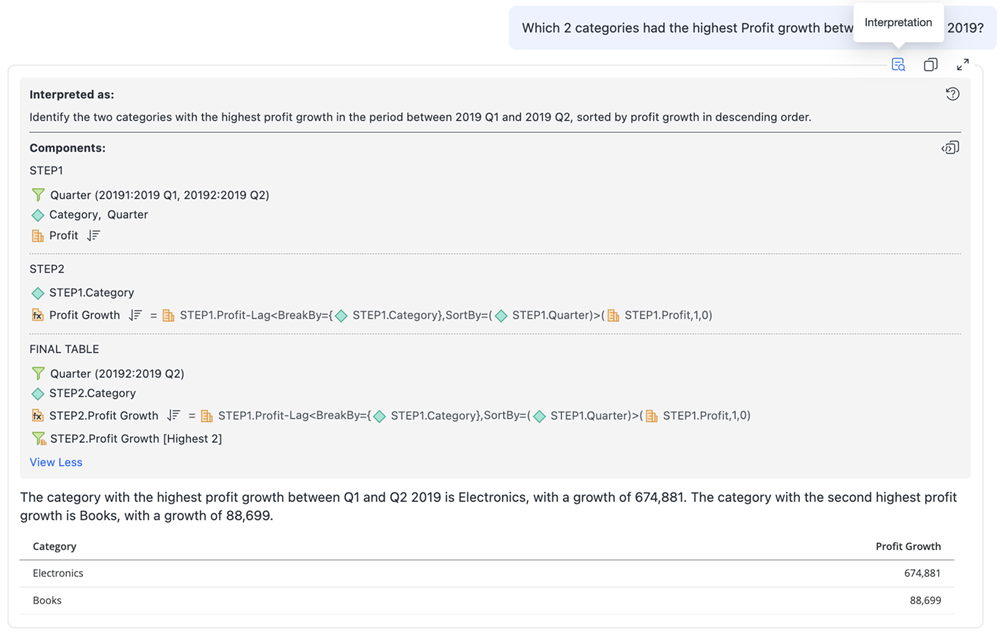
For more information about Interpretation, see Leverage AI Interpretation.
To expand on Auto Answers's capabilities to answer more complex questions, the following example demonstrates the ability to execute rankings and percentile calculations within groups. If you ask "How do products rank within each category based on their sales volume in 2019 and what percentile does each product fall into?". Auto Answers ranks products within each category by sales volume, then it determines each product's percentile rank, and offers a comprehensive overview of performance within the categories.
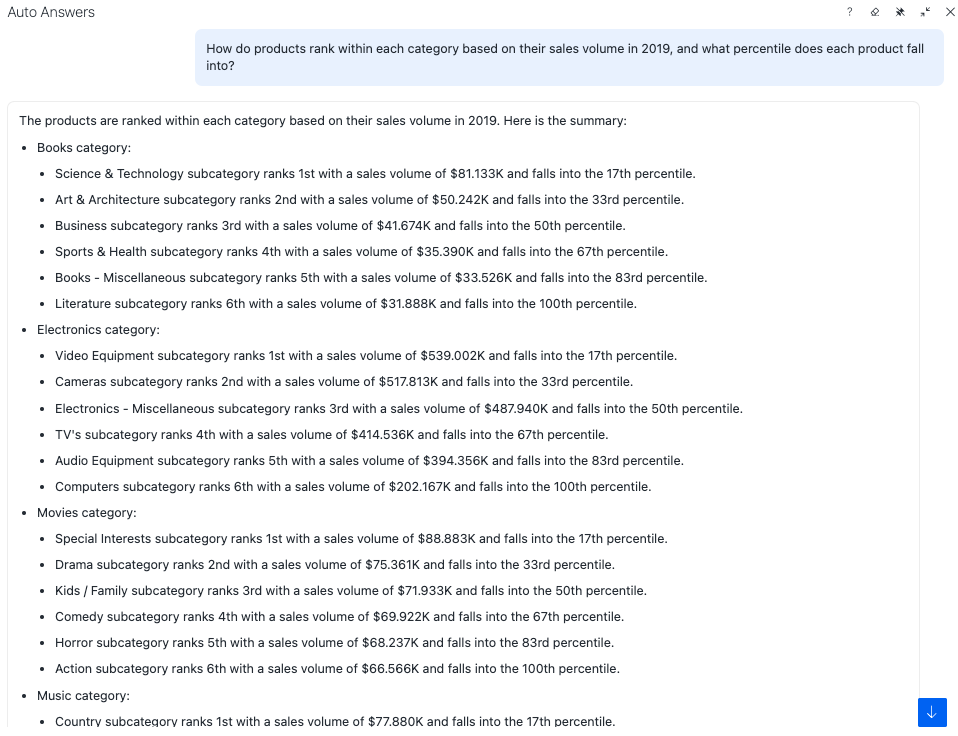
This capability empowers business users and analysts to extract multi-dimensional insights with a single question and look deeper into their data to uncover trends, anomalies, and relationships across various datasets. It enhances decision-making efficiency and provides contextually relevant insights in a conversational analytics setting, without extensive data manipulation.
