MicroStrategy ONE
Designating graph styles available for report display
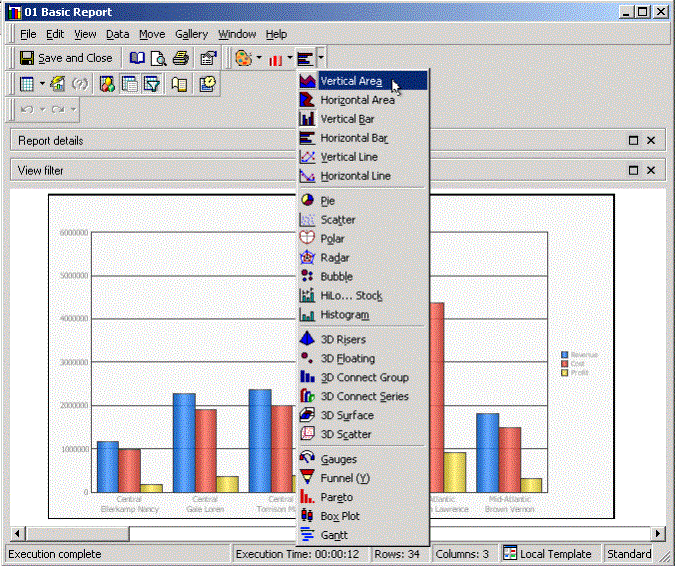
You can designate the list of graph styles that analysts can choose from to apply to a report. This procedure is a recommended part of the report creation process, because not all graph styles can be successfully applied to all reports, depending on the objects included as part of the report. Analysts should be restricted to choosing from among the subset of graph styles that work well with the report they are viewing. The following image shows the unrestricted list of the graph styles available for an analyst to select:

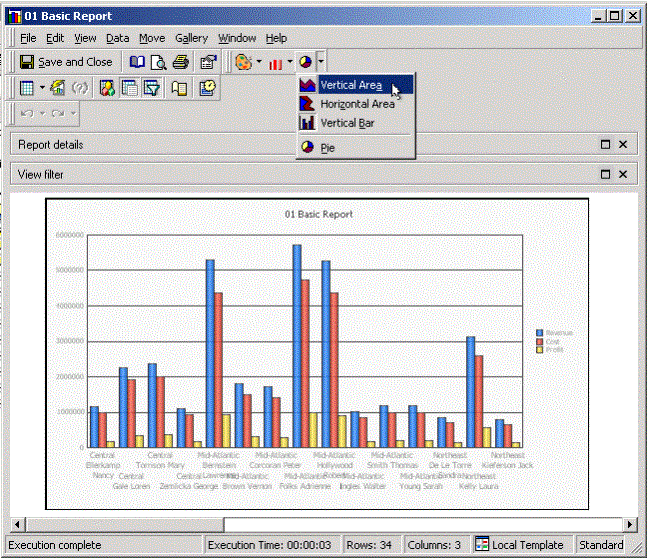
The procedure below allows you to select a subset of graph styles to make available to be applied to a report. The subset of graph styles for a report can be displayed when the report is viewed in MicroStrategy Developer, in MicroStrategy Web, or in both products. The image below shows how an analyst is restricted by selecting from a smaller subset of graph styles that suit the data being displayed in this particular report:

To determine which graph styles are appropriate for your report, and for information on report requirements for every graph style in MicroStrategy, see the Graphing chapter in the Advanced Reporting Help.
Prerequisites
This procedure requires Developer privileges.
To designate graph styles available for report display
-
Locate and open the report that you want to assign a subset of available graph styles for. The Report Viewer opens. (How?)
-
If the report is not already in Graph view, from the View menu, select Graph View to display the report as a graph. Then select a graph style in which to display the report. For guidelines on which graph styles are suitable for your report, see the Graphing chapter in the Advanced Reporting Help.
-
From the Graph menu, select Graph Preferences or Preferences.
-
Select the Graph Types tab.
-
Select Allow this report to be displayed as a graph, then select each of the graph types to be allowed for display. For guidelines on what graph styles are suitable for your report, see the Graphing chapter in the Advanced Reporting Help.
You must select the graph type that the graph is currently displayed in.
-
You can choose to have these styles available in MicroStrategy Web only (Apply only to Web), MicroStrategy Developer only (Apply only to Developer), or both Web and Developer (Apply to both Web andDeveloper). If you do not have the choice limitation displayed in a given product, then the full list of graph styles is displayed in that product.
-
Click Apply to activate your options.
-
Click OK when you are done.
