MicroStrategy ONE
Changing the hierarchical display of custom groups
A custom group is a special way of showing report data by grouping attribute elements using names that make sense to report analysts. For example, if an attribute on a report is City, the elements of that attribute might be San Francisco, Washington DC, Atlanta, and New York. A report designer might use this set of attribute elements to create a custom group made up of bands (subgroups) called Top Cities, Average Cities, and Bottom Cities, based on sales numbers for a given month. The report designer can place the custom group on a report to show those bands or subgroupings on the report rather than just listing all the cities individually.
If you see a custom group on a report, you may be able to choose to display the group elements in either a flat or a hierarchical view.
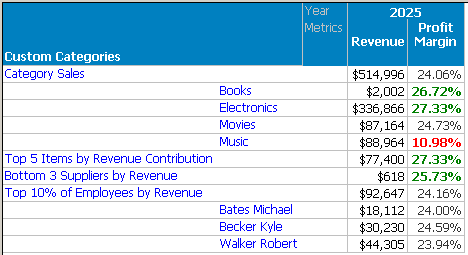
A hierarchical view displays each custom group element as a set of smaller groups, which can be repeatedly expanded until the actual attribute elements are displayed. The hierarchical view preserves the larger and smaller groupings so you can see how individual elements of the custom group have been organized. The image below shows custom groups on a report in an expanded hierarchical view.

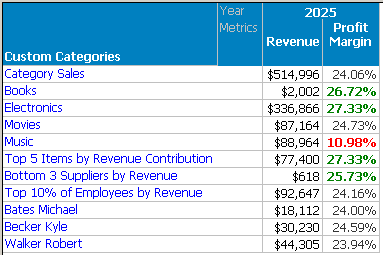
A flat view simply lists all elements of the custom group in a single, flat list with no indentation. The same report above is shown in the image below with a flattened view.

To view custom groups in a hierarchical structure on a report, you must perform the following set of procedures. Use the list below as a checklist:
Then follow the procedure below to change the hierarchical display of custom groups.
To change the hierarchical display of custom groups
Prerequisite
For custom groups to display hierarchically, hierarchical display must be enabled for the custom group and the item display of at least one custom group element must be expanded.
-
Open the Report Editor. (How?)
-
From the Data menu, choose Report Data Options. The Report Data Options dialog box opens.
-
Under Categories, expand Display, and then select Object Display. Display - Object Display appears on the right side of the editor.
-
In the Object column, select the custom group to change the display for.
-
Click in the Display column of the custom group to change. From the drop-down list, select the desired display option from the following:
-
Default: displays the custom group as set in the Custom Group Options dialog box and (for each element) Custom Group Display Options dialog box.
-
Flatten: displays the group in a flat, non-tiered format; only the element names are displayed.
-
Hierarchical: displays the group in a tiered outline format; elements and their individual items are displayed.
-
-
Click OK. You are returned to the Report Editor.
