MicroStrategy ONE
The R Integration Pack is no longer supported as of December 2024.
Using R Script Metric Expressions
You can begin to analyze statistical information with R in MicroStrategy by creating a metric. A metric is a calculation that represents a business measure or key performance indicator, in this case, the R analysis. You can use metrics in reports, documents, and dashboards.
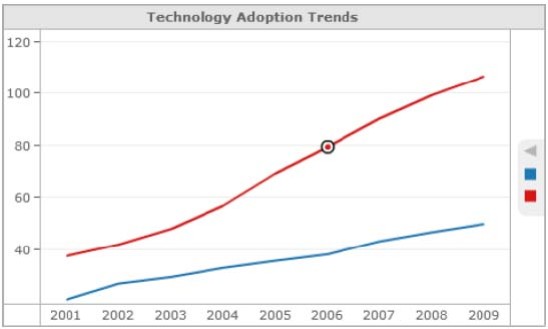
For example, trend analysis metrics have been created using R analytics. The metrics have been added to a visualization in a dashboard, as shown below:

The high-level steps for creating a metric and including an R script include:
- Create a metric using your MicroStrategy product. R scripts can be integrated with all metrics available with your MicroStrategy products, such as standalone metrics that can be included in reports and dashboards or derived metrics that are created directly within a report or dashboard.
- In the metric editor, paste the metric expression from your R script.
-
Map all of the inputs for the metric expression, which are included in parentheses and separated by commas at the end of the metric expression, to metrics. Each input must map to a single metric. To map an input, replace its name in the expression in the pane with a metric.
If you are mapping inputs for a derived metric, the metrics that you map to the inputs must all be included in the report or dashboard.
- Make any additional changes to the metric and save your metric.
- If you created a standalone metric, add the metric to a report, document, or dashboard.
-
Run the report, document, or dashboard to begin your R statistical analysis in MicroStrategy.
You can add images created using R scripts to a document to display the results of an analysis, help illustrate a trend, and so on. The image in the document is updated whenever the script to create the image is run again.
