MicroStrategy ONE
Displaying data in an interactive graph: Graph Matrix widget
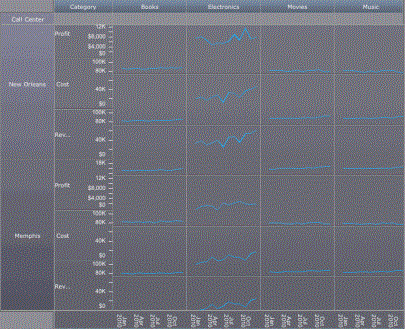
The Graph Matrix widget allows you to quickly analyze various trends across several metric dimensions. The widget consists of several line graphs that allow users to analyze and compare trends in metric data.
An example of the Graph Matrix widget is shown in the image below.

You can also define an Information Window that displays when a graph is tapped. For instructions on creating an Information Window, see Providing additional information to users: Information Windows. You can define a link in the widget to open a report or another document.
You can also use the Graph Matrix visualization in dashboards. For information on creating analyses, refer to the MicroStrategy Web Help.
