MicroStrategy ONE
Analyzing data on a Map: Maps
Some documents may display data based on locations on a map, as shown below.
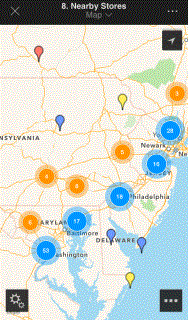
The map uses pins to represent nearby stores. Stores with pins that overlap each other are grouped together, with the number of pins in the group marked in the circle.
Some maps may show image markers or the color concentrations of a density map, instead of pins. For an example of a density map, see Analyzing data on a Map: Map.
The document containing a map may prompt you for your current location, so that the map can show locations that are within a given distance from your current location. For instructions to answer prompts on an iPhone, see Answering prompts in MicroStrategy Mobile for iPhone.
Depending upon how the map was designed, you may be able to:
-
Swipe to a different area on the map.
-
Zoom in or out by pinching the map. For some maps, markers are displayed instead of colors as you zoom in.
-
Rotate the map by placing two fingers on the map and spinning them.
-
View more information about a specific marker, by tapping the marker on the map.
-
Switch between Map, Satellite, and Hybrid views. Tap the Settings icon
 , tap Style, and then tap the appropriate button.
 -
Select a different metric to display with the markers. Tap the Settings icon
 , tap Map Based on, and select the metric you want to display.
 -
You can ungroup markers. Tap the Settings icon
 , tap Marker Type, and turn off Advanced Clustering.
 -
You can display or hide text with a marker's metric value instead of the marker. Tap the Settings icon
 , tap Marker Type, and select either Marker or Text. The map shown below has metric text displayed.
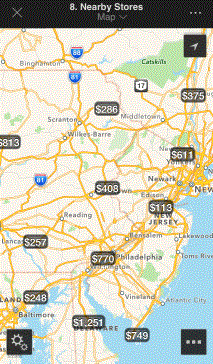
If Advanced Clustering is turned on, the metric text is for the group of markers.
-
You can select a set of locations to analyze by creating a region. To do this, tap the Select icon
 , and do one of the following:
 -
To select locations within a certain radius of a central location, tap the Circle icon. Tap the central location, then drag your finger outward until the radius is as large as you want. As you draw, the radius of the circle, in miles, is displayed.
-
To select locations within a rectangular area, tap the Rectangle icon, and then draw a rectangle on the map. As you draw, the length and width of the rectangle, in miles, is displayed.
-
To select locations by drawing a freeform shape around them, tap the Freeform icon, and then draw a shape on the map around the locations.
-
To select individual markers, tap the Marker icon, and then select markers on the map. Tap Done to create the region.
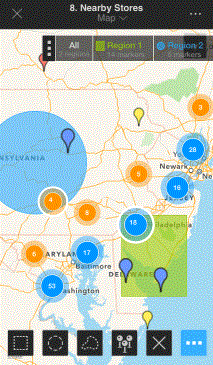
A tab for the newly defined region is displayed at the top of the screen, listing how many markers or locations are included in the region. For example, in the map displayed below, two regions have been created. First, a rectangle was drawn on the map, which created Region 1, with 20 markers. Next, a circle was drawn on the map, which created Region 2, with 30 markers. If more than one region is defined, as in this case, another tab, labeled All, is also displayed. The All tab selects all the regions.
If more than two regions are created, you can scroll through the regions in the tab by swiping the tab. To close the tab, tap the slider (shown below) in the tab.
![]()
-
After you create a region, you can analyze data by:
-
Browsing through the markers in a region. Tap the region in the region tab to display a list of the markers in the region. Tap a marker to view more information about the marker. You can browse through the details for each marker by tapping the arrows to navigate through the markers.
-
Drilling in a region. Tap the region on the map, then tap Drill. Drilling allows you to view information at lower, more detailed levels or higher, summarized levels.
-
Zooming in on the region. Tap the region in the region tap, then tap Zoom.
-
Deleting all defined regions from the map. Tap the Select icon
 , and then tap the x icon.