MicroStrategy ONE
Analyzing data on a Map: Map
Documents can display data based on locations on a map. Points of interest may be marked on the map, and may be different sizes based on the value of a metric.
The map below shows the population of large cities in Europe using colors. Darker colors indicate a higher population density.
A map may show image markers or bubble markers instead.
The document containing a map may prompt you for your current location so the map can show locations that are within a given distance from you. For information about answering prompts on an iPad, see Getting Started with MicroStrategy Mobile for iPad.
Depending on how the map was designed, you may be able to:
-
Swipe to a different area on the map.
-
Zoom in or out by pinching the map. For some maps, markers are displayed instead of colors as you zoom in.
-
Rotate the map by placing two fingers on the map and spinning them.
-
View more information about a specific marker, by tapping the marker on the map.
-
Switch between Map, Satellite, and Hybrid views. Tap the name of the current view, then tap the appropriate button.
-
Select a different metric to display with the markers. Tap the name of the current metric, then tap the metric you want to display.
-
You can select a set of locations to analyze, by creating a region. To do this, tap the Select icon
 , and do one of the following:
-
To select locations within a certain radius of a central location, tap the Circle icon. Tap the central location, then drag your finger outward until the radius is as large as you want. As you draw, the radius of the circle, in miles, is displayed.
-
To select locations within a rectangular area, tap the Rectangle icon, and then draw a rectangle on the map. As you draw, the length and width of the rectangle, in miles, is displayed.
-
To select locations by drawing a freeform shape around them, tap the Freeform icon, and then draw a shape on the map around the locations.
-
To select individual markers, tap the Marker icon, and then select markers on the map. Tap Done to create the region.
-
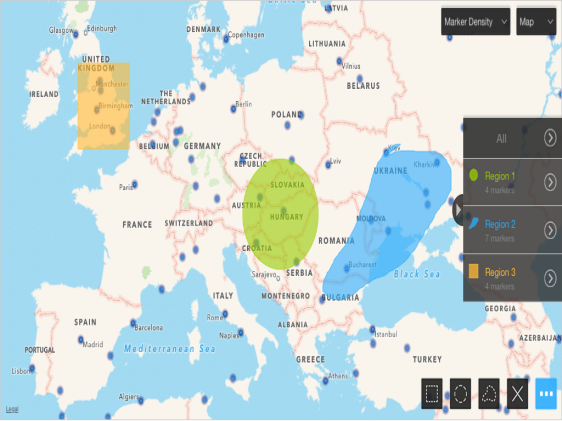
A tab for the newly defined region is displayed at the right of the screen, listing how many markers or locations are included in the region. For example, in the map displayed above, three regions have been created. First, a circle was drawn on the map, which created Region 1, with four markers. Next, a freeform shape was drawn on the map, which created Region 2, with seven markers. Finally, a rectangle was drawn on the map, which created Region 3, with four markers. Tapping All selects all the regions.
If more than two regions are created, you can scroll through the region tabs by swiping the tabs. To close the region tabs, tap the Close icon (shown below) in the region tabs.

-
After you create a region, you can analyze data by:
-
Viewing more information about a specific marker, by tapping the marker on the map.
-
Browsing through different marker information for a region, tapping the region in the region tab. Tap a marker to view more information about the marker.
-
Drilling in a region. Tap the region on the map, and then tap Drill. Drilling allows you to view information at multiple levels.
-
Zooming in on a region. Tap the region in the region tab, and then tap Zoom.
-
Deleting all defined regions from the map. Tap the Select icon
 , and then tap the x icon.
-